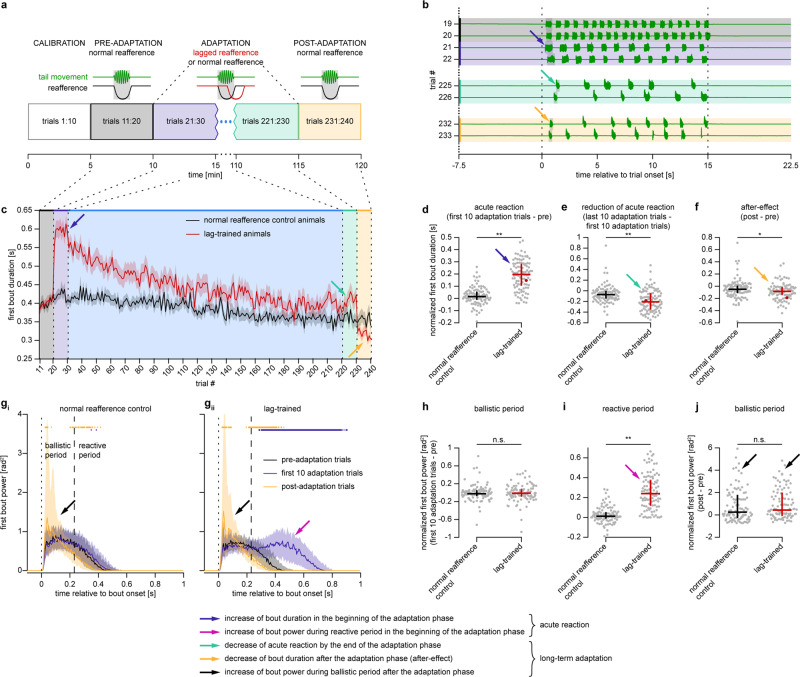
Fig. 4. Larval zebrafish adapt their behavior in response to a long-lasting perturbation in visual reafference.
a Four phases of the long-term adaptation protocol: calibration, pre-adaptation, adaptation, and post-adaptation. Two groups were tested: normal-reafference control (N = 103) and lag-trained larvae (N = 100), who received lagged reafference during the adaptation phase (red trace). b Tail traces from eight trials in a lag-trained fish. Dotted lines show when the grating was moving forward. Vertical shaded bars indicate first swimming bout in each trial. Blue arrow indicates increase of first bout duration in the beginning of the adaptation phase (acute reaction), cyan arrow indicates decrease of bout duration by the end of the adaptation phase (reduction of acute reaction), and orange arrow indicates decrease of bout duration in the post-adaptation phase (after-effect). c First bout duration in each trial (mean ± SEM across larvae). d–f Quantification of acute reaction (d) and long-term adaptation effects: reduction of acute reaction (e) and the after-effect (f). Each dot represents first bout duration in one fish, averaged across ten trials and normalized by subtracting the value from the pre-adaptation phase (d, f) or from the first ten trials of the adaptation phase (e). d–j Median and interquartile range across larvae are shown, n.s. p ≥ 0.05, *p < 0.05, **p < 0.01 (d 7.92 × 10⁻²¹, e 1.25 × 10⁻⁶, f 0.02, h 0.88, i 6.66 × 10⁻²², j 0.27; Mann–Whitney U-test with two-tailed alternative). Red dots represent example fish shown in b. g First bout power profile in different experimental phases of normal-reafference control (i) and lag-trained larvae (ii), averaged within blocks of ten trials in each larva. Dashed lines separate ballistic and reactive periods. Thick horizontal colored lines indicate time points, at which mean bout power is different from the pre-adaptation level (Wilcoxon signed rank test, p < 0.05/220, where 220 is the total number of tested time points). Black arrows indicate increase of ballistic power during the experiment. h–j Quantification of the change in mean bout power during the experiment: acute reaction of ballistic bout power (h), of reactive bout power (i), and the after-effect in ballistic bout power (j). Each gray dot represents the area below the first bout power curve in one fish, computed over its respective bout period, averaged across ten trials and normalized by subtracting the value from the pre-adaptation phase.

