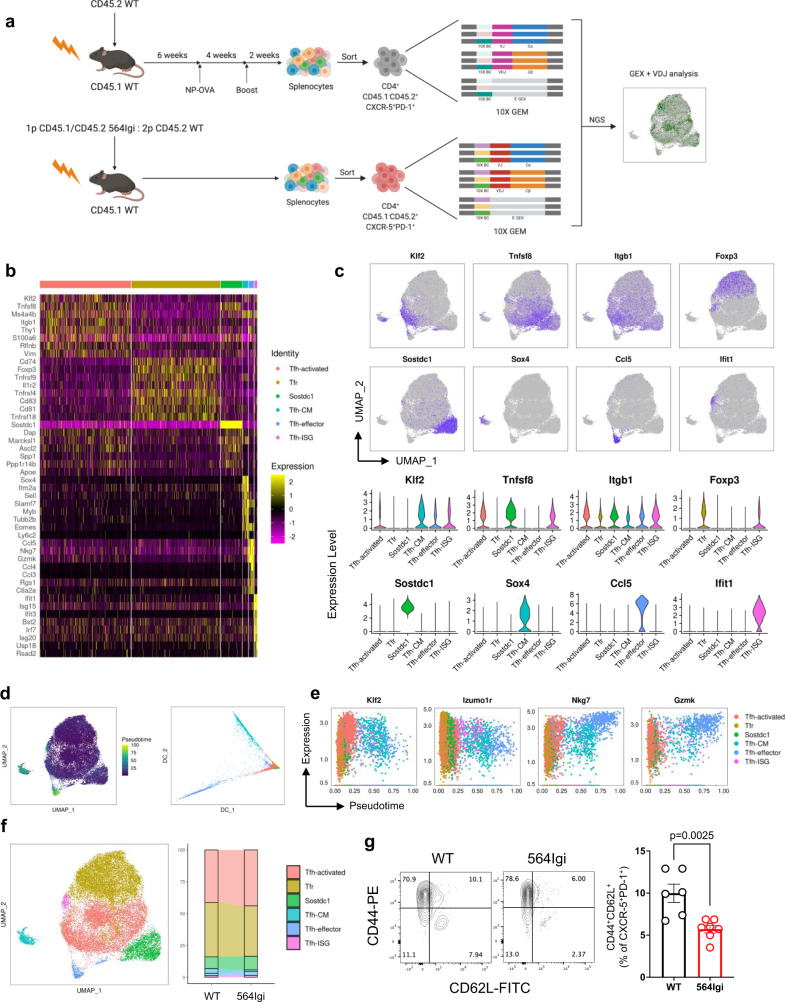
Fig. 1. Identification of six follicular T cell clusters by scRNA-seq.
a Schematic of experimental design to generate autoimmune bone marrow chimeras and isolate follicular T cells, followed by generation of 10X Gel Bead-In Emulsions (GEM) and single cell next-generation sequencing (NGS) to generate paired gene expression (GEX) and VDJ sequences. b Heatmap of individual cell’s (columns) expression of the top eight differentially expressed genes (rows) for each cluster (top colors). Log-normalized expression scaled for each gene. c Gene expression of cluster-defining genes projected onto UMAP (top) or within individual clusters (bottom) identified by scRNA-seq and unbiased clustering of follicular T cells. d Pseudotime projected onto UMAP (left) and diffusion map of diffusion component (DC) embeddings of cells colored by clusters (right). e Dot plots of correlation between pseudotime and gene expression of cells colored by cluster. f UMAP visualization of follicular T cells colored by unbiased cluster assignment (left) and stacked bar graph of percent of cells belonging to each cluster between wild type (WT, n = 5) and autoimmune (564Igi, n = 5) chimeras (right). g Flow cytometry contour plots (left) and quantification (right) of central memory frequency amongst CXCR5+PD-1+ cells from wild type (WT, n = 6) and autoimmune (564Igi, n = 7) chimeras. Data are represented as mean ± SEM. P-value computed using two-tailed Student’s t-test. Source data are provided as a Source data file.

