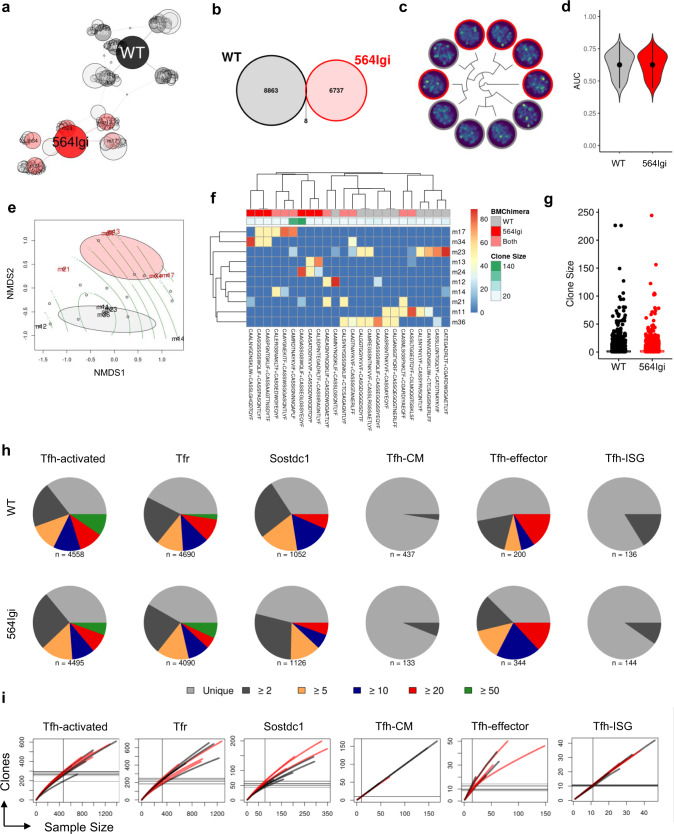
Fig. 3. Public clonotypes are distinct between autoimmune and non-autoimmune follicular T cells.
a Unweighted network analysis of expanded clonotypes (>10 individual cells) from WT (black) and mixed 564Igi (red) chimeras. Clonotypes are defined by paired full length TCRα and TCRβ sequences. Individual samples are depicted as colored circles, clonotypes are depicted as gray circles and sized according to number of cells belonging to given clonotype. Edges represent clonotype membership to individual samples. b Venn diagram comparing number of unique and shared clonotypes between WT (black) and mixed 564Igi (red) chimeras. c Repertoire dendrogram of variable autoencoder-based featurization of TCR repertoires of individual samples represented in UMAP space. Dendrogram represents inter-repertoire symmetric Kullback–Leibler divergence computed from sample-agnostic network-based clustering. Color of node indicates sample condition (gray, WT; red, 564Igi). d Performance of K-nearest-neighbors instance-based unsupervised classification algorithm applied to TCR repertoire featurization assessed by area under the curve (AUC). Data are represented as mean ± SD. e Ordinance plot of non-metric multidimensional scaling (NMDS) of clonotype distribution amongst individual samples. Text indicates sample name and color indicates sample condition (gray, WT; red, 564Igi). Individual clonotypes are depicted as gray circles. f Hierarchical clustering of public clonotypes based on distribution amongst chimeras (rows). Column colors indicate sample condition of given clonotype (gray, WT; red, 564Igi; light red, both) and number of individual cells belonging to each clonotype. Columns are labeled with CDR3 sequences from TCRαβ pairings. g Number of individual cells belonging to each clonotype amongst WT (black) or mixed 564Igi (red) chimeras. h Pie charts of clonal expansion of follicular T cell clusters identified by scRNA-seq (columns) in WT (top) or mixed 564Igi (bottom) chimeras. Number of cells with both TCRα and TCRβ successfully identified is shown below each pie chart. For clonotypes expressed by two or more cells, the number of cells expressing that clone is shown by a distinct color. i Rarefaction curves of clonotype richness within follicular T cell clusters identified by scRNA-seq. Individual samples are depicted by lines and colored by sample condition (black, WT; red, 564Igi).

