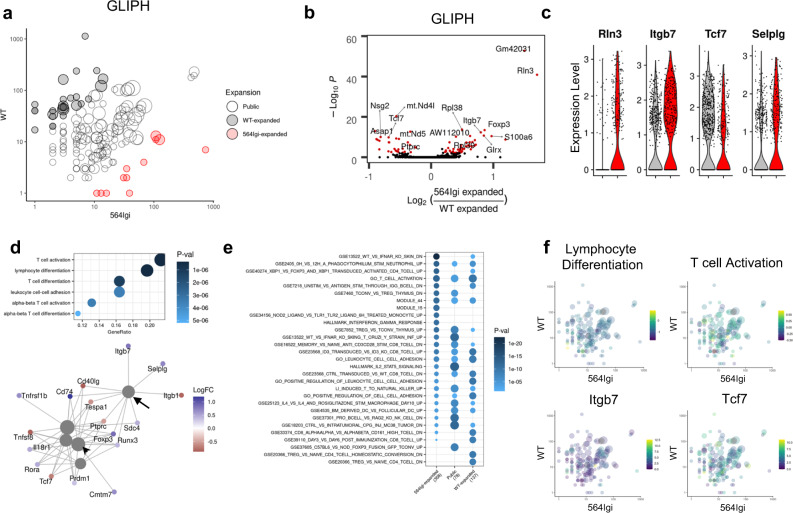
Fig. 6. TCR specificities enriched in autoimmune disease are transcriptionally distinct.
a Scatter plot comparing specificity group size between WT and mixed 564Igi chimeras. Specificity groups are colored according to preferential expansion (absolute log2FC > 2.5 and total size >10) in WT (black) or mixed 564Igi (red) chimeras and sized according to number of samples in which the given clonotype is observed. b Volcano plots of differentially expressed genes between cells belonging to preferentially expanded specificity groups in mixed 564Igi versus WT chimeras indicated in (a). Adjusted P-value <0.01 and log2FC > 0.2 shown in red. Differential expression computed by MAST and adjusted for multiple comparison based on Bonferroni correction. c Violin plots of expression of indicated genes in cells belonging to preferentially expanded specificity groups in WT (gray) or mixed 564Igi (red) chimeras. d Gene ontology analysis (top) and network plot (bottom) of differentially expressed genes between cells belonging to preferentially expanded specificity groups in mixed 564Igi versus WT chimeras indicated in (a). Top; size represents gene ratio and color represents P-value. Bottom; gray circles represent gene sets and colored dots represent genes colored by log2FC in mixed 564Igi compared to WT chimera follicular T cells. Arrow identifies leukocyte cell–cell adhesion module (GO:0007159) and arrowhead identifies lymphocyte differentiation module (GO:0030098). P-value computed by gene ontology enrichment analysis and adjusted for multiple comparisons using Benjamini–Hochberg procedure. e Biological theme comparison of annotated gene sets between cells belonging to specificity groups without a condition preference (public) or preferentially expanded in WT (black) or mixed 564Igi (red) chimeras. Size represents gene ratio and color represents P-value. P-value computed by gene ontology enrichment analysis and adjusted for multiple comparisons using Benjamini–Hochberg procedure. f Scatter plot comparing specificity group size between WT and mixed 564Igi chimeras and colored according to lymphocyte differentiation module score (GO:0030098, top left), T cell activation module score (GO:0042110, top right), and average expression of Itgb7 (bottom left) and Tcf7 (bottom right). Module scores were calculated using average expression of all genes of cells belonging to each specificity group.

