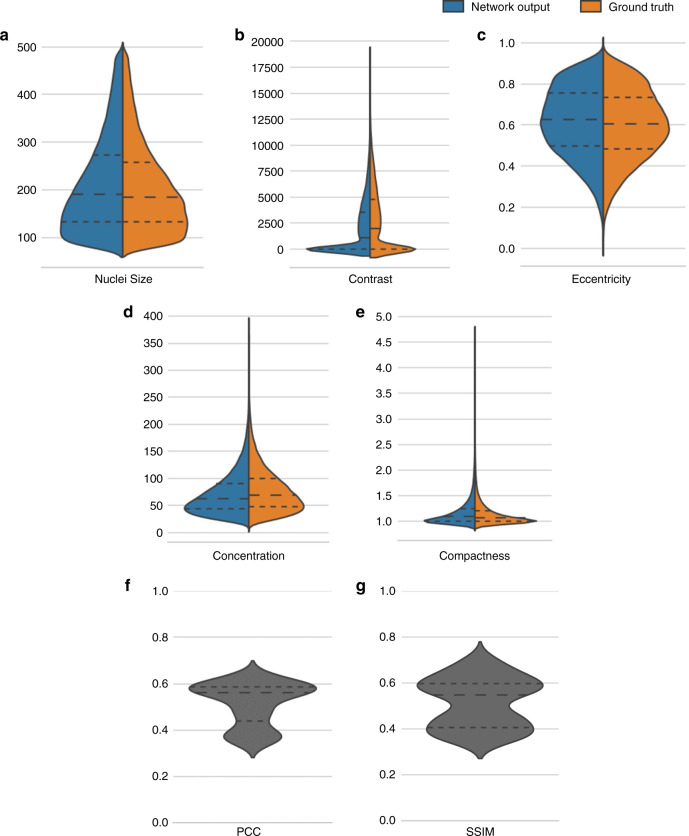
Fig. 5. Quantitative analysis of the acetic acid virtual staining results on ex vivo skin tissue samples.
a–e Violin plots show quantitative comparisons of the statistical distribution of the measured nuclear morphological parameters between the acetic acid virtually stained skin tissue images (blue) and their corresponding ground truth images obtained using actual acetic acid staining (orange). Five metrics are used for the comparison: a nuclear size, b contrast, c eccentricity, d concentration, and f compactness (see Materials and Methods for details). The statistical results cover a total number of 96,731 nuclei, detected in 176 ex vivo tissue images of normal skin. f, g Violin plot shows the statistical distribution of the PCC and SSIM values measured through comparing the virtually stained (acetic acid) tissue images against their corresponding actual acetic acid-stained ground truth images. In all the violin plots presented above, the dashed lines from top to bottom represent the 75, 50 (median), and 25 quartiles, respectively.

