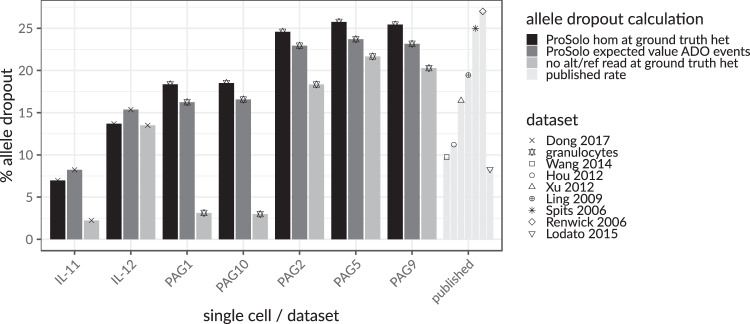
Fig. 2. Concordance of three differently calculated per-cell (IL-1 and PAG cells) allele dropout rates across ground truth heterozygous sites, in the context of allele dropout rates from the literature21,22,26,32–36.
The expected value of the allele dropout events in ProSolo (dark gray) is concordant with the number of false homozygous genotype calls made by ProSolo on those sites (black) and both values are well within the range of published allele dropout rates for single-cell MDA sequencing data (“published”, to the right, very light gray). The naive allele dropout rate (light gray)—calculated as ground truth heterozygous sites with a minimum coverage of seven and either no read with the reference allele or no read with the alternative allele—-shows discrepancies with ProSolo’s estimates of allele dropout for samples with a more uniform coverage (IL-11, PAG1, PAG10, Supplementary Fig. 3).

