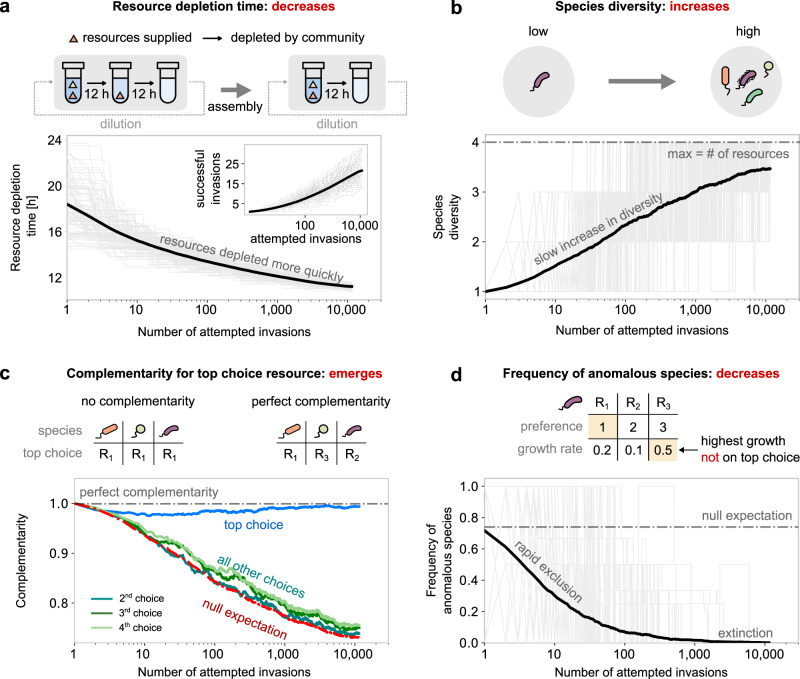
Fig. 2. Emergent properties of diauxic microbial communities.
In all plots, solid bold lines represent the average over 958 individual community assembly simulations, while gray lines correspond to 100 randomly chosen community assembly simulations. a Total resource depletion time during community assembly (the time taken by the community to deplete all available resources). (Inset) Number of successful invasions during community assembly. b Total species diversity during community assembly (number of surviving species at steady state). c Resource utilization complementarity during community assembly. For each time point, the nth choice complementarity was calculated as a number of unique resources among the n-th preferred choices of all species in the community, divided by the number of unique resources in the environment. For a certain community, the null expectation (complementarity without selection) was defined by the complementarity of a random set of species from the pool that has the same diversity of that community. Colored lines show the average trend of complementarity on each preferred resource choice: top (light blue), second (cyan), third (deep green), and fourth (light green). The red dash-dotted line shows the average trend of null expectation. The gray dash-dotted line at the top corresponds to the perfect complementarity, which is 1. d Frequency of species with anomalous resource preferences during community assembly. The gray dash-dotted line is the expectation of fraction of anomalous species (75%) in the pools.

