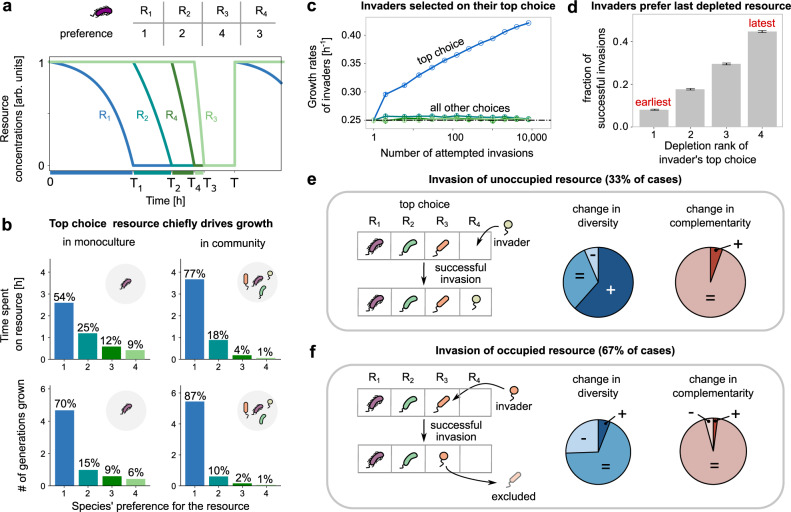
Fig. 3. Top choice resources chiefly drive community diversity and complementarity.
a (top) Table showing the preferences of a diauxic microbial species (purple) for 4 resources, R1 to R4. (bottom) Plots showing the depletion of the 4 resources by the purple species during one serial dilution cycle, when grown alone in our model. b (top) Bar plots showing the time taken by the purple species in (a) to grow on each of the 4 resources. Percentages on each bar represent the fraction of time spent growing on each resource. (bottom) Bar plots showing the number of generations grown, or the number of doublings by the species when growing on each resource. In both cases, the plots on the left show the quantities when the purple species is in monoculture (growing alone), and those on the right show them when the purple species is in a community with 3 other species. c Mean growth rates of successful invaders during community assembly. The blue line corresponds to the invader’s top choice, while the other colors correspond to all other choices. The horizontal dashed line shows the mean growth rate of the species pool. Each quantity represents a moving average from 958 independent community assembly simulations. Error bars represent s.e.m. d Fraction of the successful invasions as a function of the order in which the invader’s top choice resource is depleted, 1 indicating cases where the invader prefers the earliest depleted resource, and 4 where it prefers the last depleted resource. Each bar represents the mean of such a fraction over 958 independent community assembly simulations, and error bars represent s.e.m. e, f Effect of invasions of community diversity and complementarity, based on whether the invader’s top choice was (e) unoccupied or (f) occupied. Cartoons show the typical effect of an invasion. Pie charts show the fraction of invasions that increase, decrease or maintain a community’s species diversity (middle) and complementarity (right). On unoccupied resources, diversity typically increases (62%), but sometimes stays constant (32%) or decreases (6%). On occupied resources, diversity typically stays the same (68%), but sometimes decreases (26%) and rarely increases (6%). In almost all cases complementarity either stays maintained or increases (>95%), and very rarely decreases (<5%). Source data are provided as a Source data file.

