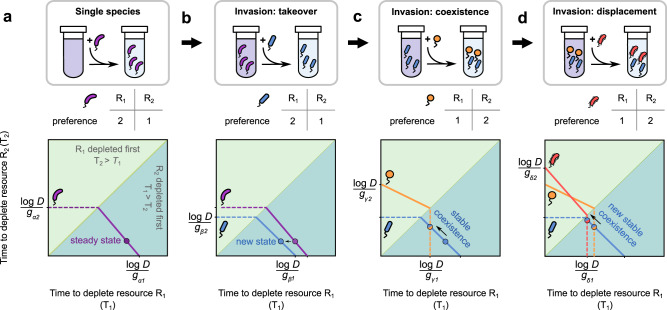
Fig. 4. A geometric approach for serially diluted communities explains how complementarity promotes diversity.
Representation of stepwise community assembly in our geometric approach. a Resource utilization time plane for a single diauxic species (purple) growing on 2 resources, R1 and R2. The x-axis represents the time taken to deplete R1, and the y-axis for R2. Each species is characterized by a zero net growth isocline (ZNGI) comprising two line segments: a dashed line indicates the less preferred resource, while the solid line indicates the more preferred resource (the table shows preferences). In monoculture, the steady state can only occur on the solid line, here the bold circle. The T1 = T2 line separates the plane into two triangular regions: in the light green region, R1 is depleted first, while in the dark green, R2 is. b Representation of a new species invasion, where the invader (blue) takes over and displaces the purple resident. The invader has the same resource preferences as the resident, but its ZNGI is closer to the origin, suggesting that it depletes resources faster. The new steady state is shown as a bold blue circle. c Representation of a new species invasion, where the invader (orange) coexists with the new resident (blue). The invader has complementary preferences to the resident, indicated by the solid segment of its ZNGI in the light green region. Both species stably coexist (see Supplementary Text, sections A and B) at the intersection of their ZNGIs (orange/blue circle). d Representation of a new species invasion, where the invader (red) displaces only one of the residents, that with the same top choice resource (orange). The invader (red) and the resident (blue) coexist stably at the intersection of their ZNGIs (red/blue bold point). In all cases, the point marking the steady state moves closer to the T1 = T2 line, showing that the depletion times for both resources become similar to each other.

