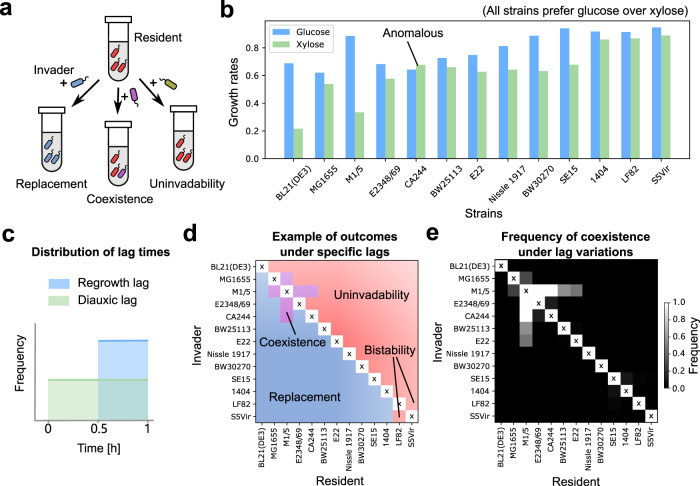
Fig. 6. Predicting pairwise co-culture outcomes of diauxic laboratory E. coli strains.
a Schematic of pairwise invasion simulations. For each invasion event, a small amount of an invader strain was added into the monoculture of the resident strain. The system was then serially diluted until reaching a steady state. We simulated these pairwise invasions using E. coli strains discussed in ref. 46, where their growth rates and yields were measured in experiments. An invader either replaces the resident, coexists with it, or is unable to invade. b Growth rates of the 13 laboratory E. coli strains on glucose (blue) and xylose (green), obtained from Barthe et al.46. Note that one of the strains is anomalous. c Distribution of the initial lags (uniform between 0.5 and 1 h) and diauxic lags (uniform between 0 and 1 h) used in simulations. In each of 100 simulation runs, we randomly sampled the lag times of each strain, and performed exhaustive pairwise invasion simulations. d An example of competitive outcomes, showing 1 of the 100 runs. In most circumstances, the invader beats the resident (blue) or fails to invade (red). Coexistence (purple) or bistability can also occasionally happen. e Frequency of coexistence. A strain on the y-axis invades the monoculture of a strain on the x-axis, and the greyscale represents the frequency that both strains survive in the steady state among 100 runs where lag times were sampled.

