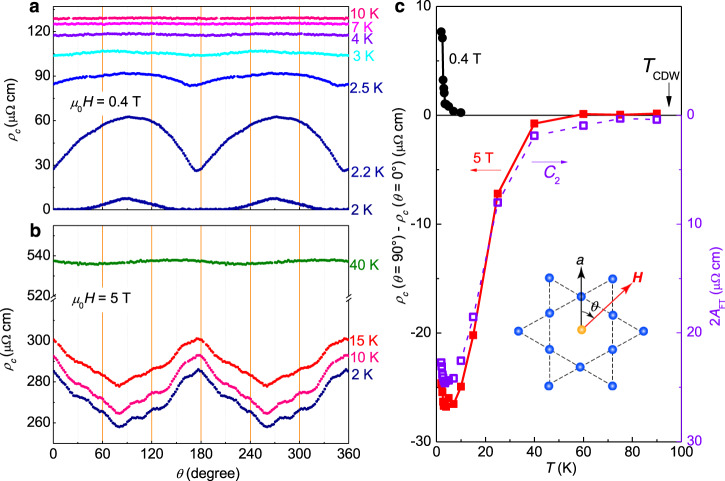
Fig. 4. Temperature evolution of the nematicity of c-axis resistivity.
Angular dependent c-axis resistivity measured at different temperatures under a magnetic field of a 0.4 and b 5 T. c Temperature dependence of the nematicity. The solid symbols represent the c-axis resistivity difference between θ = 0° and 90° at 0.4 and 5 T, while the open symbols show twice the amplitude of the 180° (or C2) peak (2AFT,C2) from FT results (Supplementary Fig. 8a) to ρc(θ) curves measured at different temperatures under 5 T. One can see that the latter is more sensitive to show the C2 symmetry which seems ending near TCDW.

