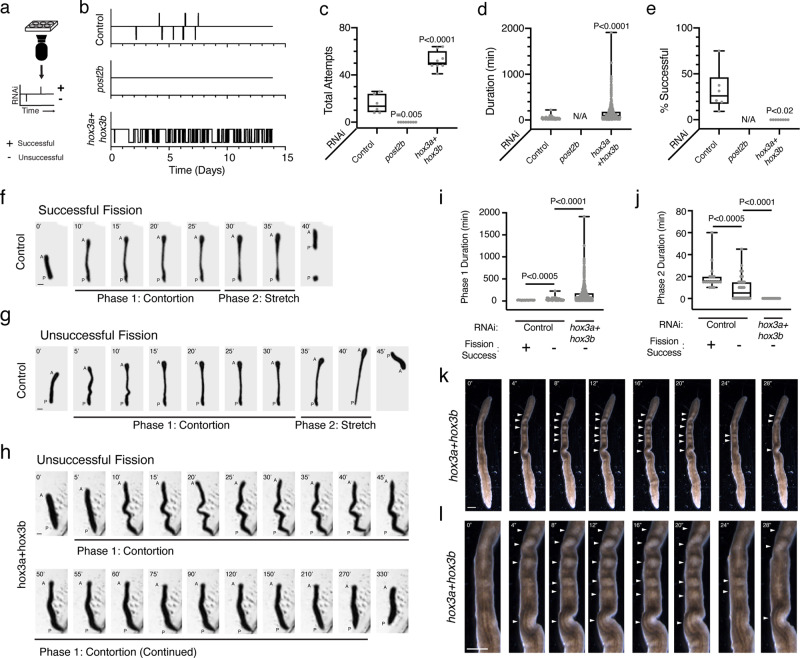
Fig. 3. post2b and hox3 are opposing regulators of asexual reproductive behavior.
a Diagram of webcam time-lapse imaging and timeline visualization depicting successful (upward displacement) and unsuccessful (downward displacement) fission attempts. b Representative activity timelines of fission behavior from live imaging of control, post2b, and hox3a + hox3b RNAi animals. c–e Plots of (c) total number of fission attempts (Control vs. post2b and hox3a + hox3b p-values = 0.005 and <0.0001, respectively), (d) duration of each attempt (Control vs. hox3a + hox3b, p-value < 0.0001), and (e) percentage of successful attempts for RNAi-treated animals (Control vs. hox3a + hox3b p-value = 0.194). n = 8, 6, and 6 animals for Control, post2b, and hox3a + hox3b RNAi samples, two independent repeats. Source data are provided as a Source Data file. f–h Representative images (5 min per frame, A = anterior, P = pre-fission posterior, and P’ = post-fission posterior) of (f) successful and (g, h) unsuccessful fission attempts divided into Phase 1 (Contortion) and Phase 2 (Stretch) for (f, g) control and (h) hox3a + hox3b RNAi-treated animals (experiment independently repeated once). i, j Plots of the duration of (i) Phase and (j) Phase 2 within each fission attempt for RNAi-treated animals (n = 18, 50, and 476 fission events for Ctl Successful, Ctl Unsuccessful, and hox3a + hox3b Unsuccessful, respectively; Ctl Successful vs. Ctl Unsuccessful p-value = 0.0005; Ctl Unsuccessful vs. hox3a + hox3b Unsuccessful p-value < 0.0001). Source data are provided as a Source Data file. k, l Representative images of the (k) entire body or the (l) pre-pharyngeal region of hox3a + hox3b RNAi-treated animal stalled in Phase 1 (n = 10/10 animals, arrows indicate tissues undergoing peristaltic contractions, two independent repeats). Animals were given 17 bacterial RNAi feedings. Scale, 1 mm. Box and whisker plot depicts individual data points, median (center), 25th/75th percentile (bounds of box), and minima/maxima (whiskers). p-values calculated by Welch’s two-tailed t-test. Scale, 1 mm.

