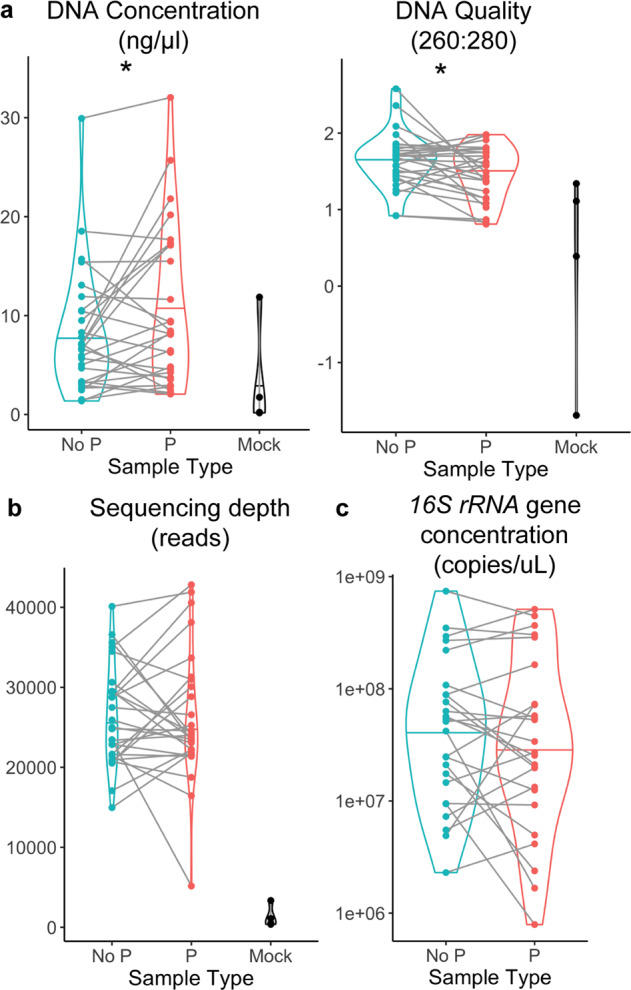
Fig. 2. DNA extraction and sequencing, according to saliva collection method.

The figure compares samples in preservative (P), or not (No P), or mock samples. a DNA quantity and quality post-extraction; *p < 0.05, linear mixed effect model. b Sequencing depth after processing in QIIME2; not significant, linear mixed effect model. c 16S rRNA gene concentration in the two sample types; not significant, linear mixed effect model. Center line on plots indicates median.
