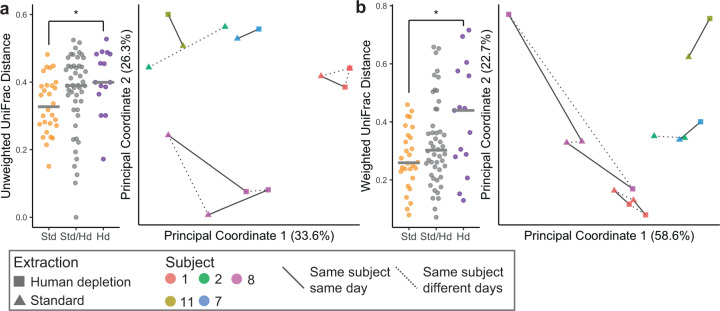
Fig. 6. Phylogenetic beta diversity metrics of taxonomy determined from shotgun sequencing.
Unweighted (a) and weighted (b) UniFrac of all samples according to the DNA extraction method. Left panels: Median distances in within-sample comparisons: standard vs standard (Std), human depletion vs human depletion (Hd) and across samples: standard vs human depletion (Std/Hd). Center line on plots indicates median. Right panels: PcoA plots of all samples by the extraction method; pairwise Wilcox test with FDR correction *q < 0.05. Lines connect specimens collected from the same subject on the same day (solid) or different days (dotted).

