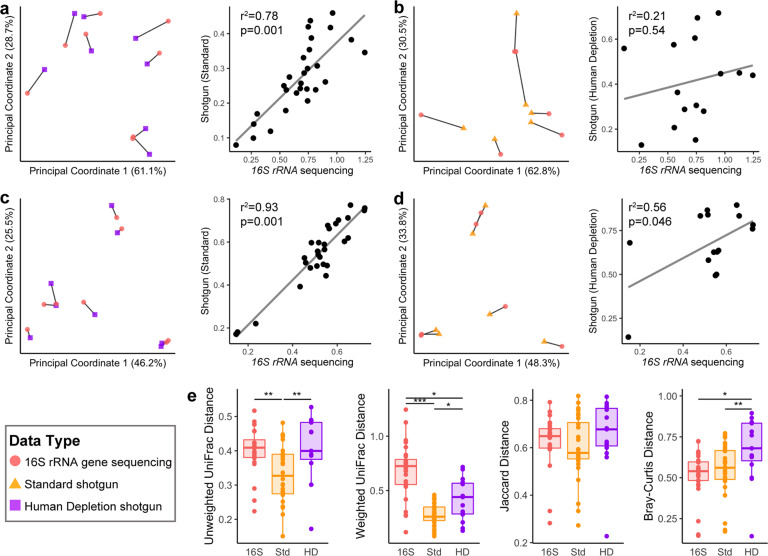
Fig. 7. Procrustes analysis of 16S rRNA gene and shotgun data of phylogenetic beta diversity.
Weighted UniFrac (a) and Bray–Curtis (c) analysis comparing results from the 16S rRNA gene sequencing and the standard extraction shotgun sequencing. Weighted UniFrac (b) and Bray–Curtis (d) analyses comparing results from the 16S rRNA gene sequencing and human DNA depletion shotgun sequencing. Left panels: PCoA plots from procrustes analysis. Lines connect same samples across sequencing type. Right panels: Correlation plot from Mantel test comparing the two distance matrices. e Comparison of distances of all the shared samples between sequencing types. Center line on plots indicates median, box is IQR. *p < 0.05, **p < 0.01, ***p < 0.001.

