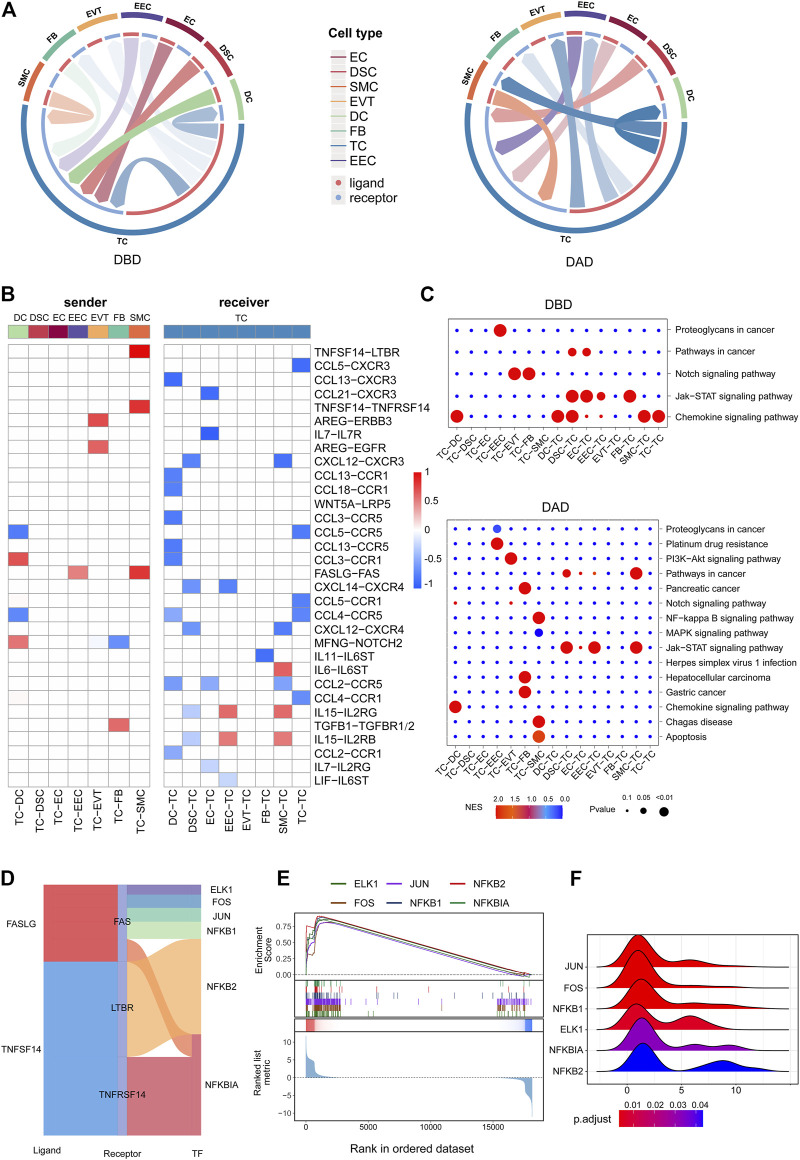
FIGURE 4.
Intercellular communication related to TCs. (A) Circos plot of intercellular communication related to TCs in DBD and DAD. (B) Differential intercellular communication related to TCs; red represents significantly increased intercellular communication in DAD; blue represents significantly decreased intercellular communication in DAD. (C) Pathway activity analysis of differential intercellular communication related to TCs. (D) Sankey plot of three intercellular signals related to TCs. (E) Enrichment analysis of six TFs (the target gene set of the TF) downstream of the three intercellular signal pathways. (F) Ridge plot of the density distribution of FC of TGs for the six TFs.

