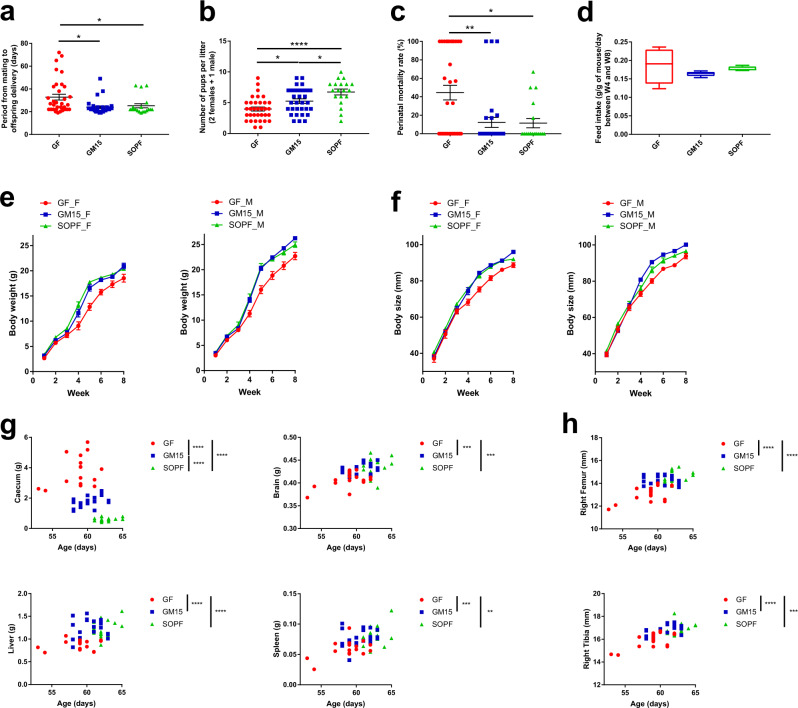
Fig. 3. Macroscopic phenotyping of mice from two consecutive filial generations (F1–F2).
a–c One-way ANOVA analyses of the reproductive performance, where dots, lines, and error bars represent, respectively, individual litters (34 GF, 31 GM15, and 19 SOPF), means, and SEM. a Pups delivery. Data are represented as days after mating. Dunn’s multiple comparison analyses. b Number of pups per litter. Data are represented as an individual number. Tukey’s multiple comparison analysis. c Perinatal mortality. Data are represented as percentages of mortality. Dunn’s multiple comparison analyses. d Feed intake normalized per gram of mouse per day over 4 weeks (17 GF, 21 GM15, and 20 SOPF mice housed in 6, 5, and 4 cages, respectively). Box plots extend from the 25th to 75th percentiles and show the center line as the median. Whiskers represent min and max data. e, f Body growth of mice bred with their mothers until week 4, where lines and error bars represent, respectively, means and SEM. Female (F) and male (M), respectively. Body weight and size curves. GF mice (7 F, 10 M), GM15 mice (9 F, 12 M), and SOPF mice (10 F, 10 M). g, h Organs weight or size impacted by age, filial generation, or sex were analyzed by the F test for multiple linear regressions, otherwise by one-way ANOVA. Each animal is represented by a dot at the age of the sacrifice (17 GF, 21 GM15, and 20 SOPF). *P < 0.05, **P < 0.01, ***P < 0.001, and ****P < 0.0001. Source data are provided as a Source Data file.

