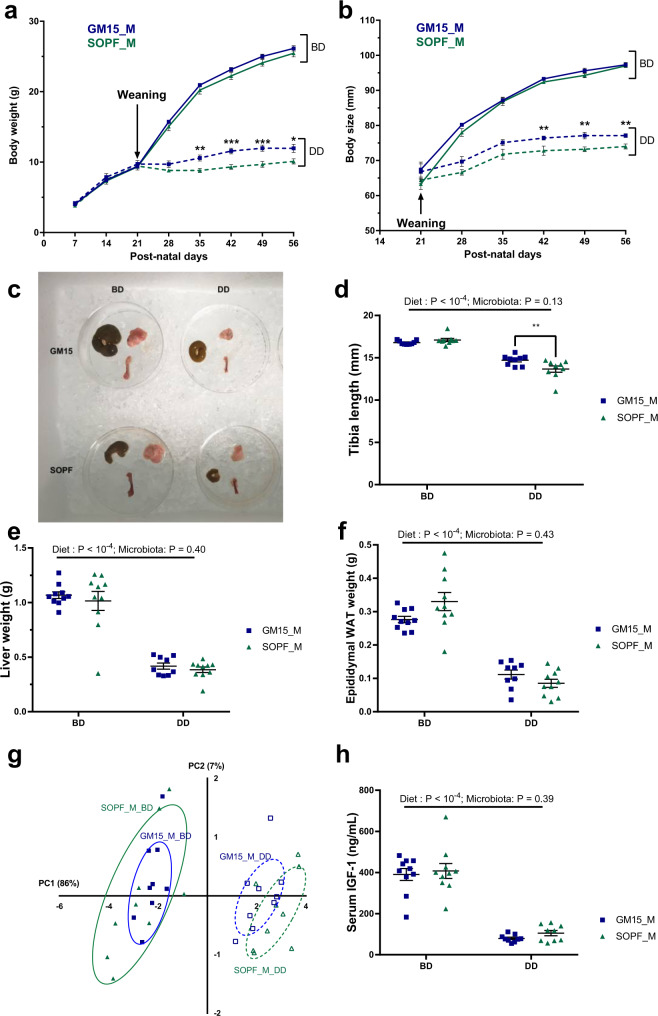
Fig. 6. GM15 mice and SOPF response under postweaning chronic undernutrition.
a–h Dot plots where dots, lines, and error bars represent respectively individual mice, means, and SEM. Male (M), breeding diet (BD), and depleted diet (DD), respectively. Body weight (a) and body size (b) were measured every week from weaning to postnatal day 56 (ten males per group). c Representative picture of the cecum, subcutaneous fat, and right femur of mice at day 56. Tibia length (nine males per group) (d), liver (ten males per group, except nine GM15_M_DD) (e), and epididymal white adipose tissue (WAT) (ten males per group, except nine GM15_M_DD) (f) weight were measured. g PCA of tissues weight and bones size under control conditions (BD) or under nutritional stress (DD). Brown adipose tissue was excluded, given its lack of correlation with other parameters (Supplementary Fig. 8h). Percentages on each axis indicate the variance associated with each coordinate (nine males per group). h Serum IGF-1 at day 56 (ten and nine males per BD and DD groups, respectively). P values after two-way ANOVA were adjusted for Sidak’s post hoc test for multiple comparisons. *P < 0.05, **P < 0.01, and ***P < 0.001. Source data are provided as a Source Data file.

