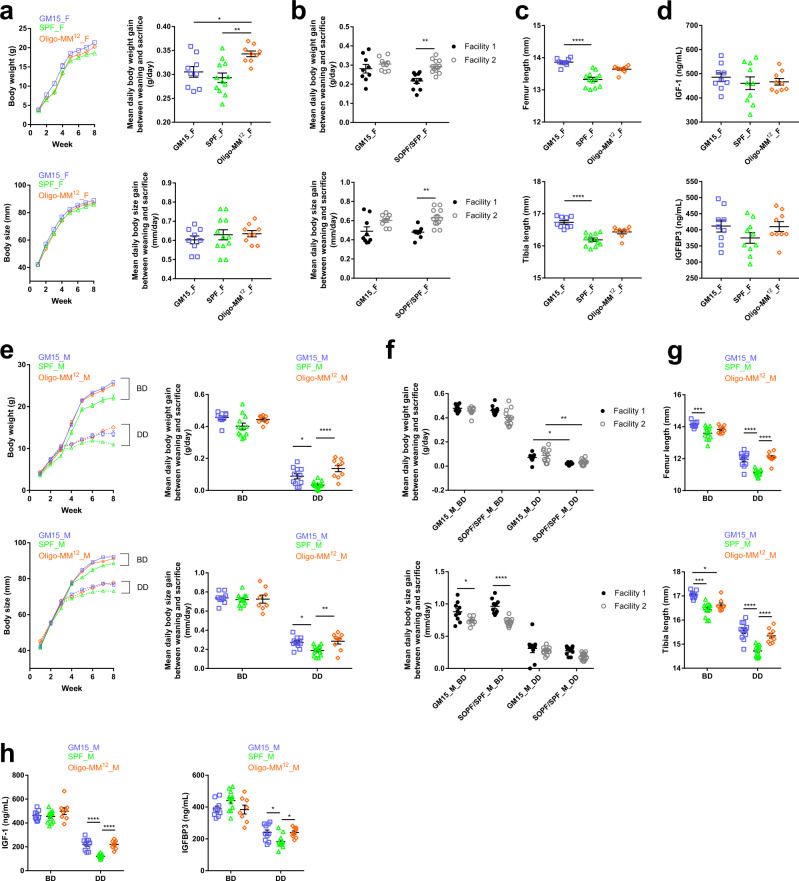
Fig. 8. The GM15 model growth and diet-induced stunting phenotypes are reproducible in another gnotobiotic facility.
a–h Macroscopic phenotype of mice where dots, lines, and error bars represent, respectively, individual mice, means, and SEM. Female (F) and male (M), breeding diet (BD), and depleted diet (DD), respectively. a, e Body weight or size curves and mean daily gain of animals in facility 2. One-way ANOVA followed by Tukey’s multiple comparison analyses (GM15 mice: 9 F, 9 M_BD, 11 M_DD; SPF mice: 12 F, 12 M_BD, 13 M_DD; Oligo-MM12 mice: 9 F, 8 M_BD, 9 M_DD). b, f Mean daily body weight and size gain comparison between GM15 and SOPF/SPF mice in facilities 1 (GM15 mice: 9 F, 10 M_BD, 9 M_DD; SOPF mice: 10 F, 10 M_BD, 10 M_DD) and 2 (GM15 mice: 9 F, 9 M_BD, 11 M_DD; SPF mice: 12 F, 12 M_BD, 13 M_DD). One-way ANOVA followed by Tukey’s multiple comparison analyses. c, g One-way ANOVA analyses of femur and tibia length of animals in facility 2. One-way ANOVA followed by Dunn’s and Tukey’s multiple comparison analyses for F and M data sets, respectively (GM15 mice: 9 F, 9 M_BD, 11 M_DD; SPF mice: 12 F, 12 M_BD, 13 M_DD; Oligo-MM12 mice: 9 F for femur and 8 F for tibia, 8 M_BD, 9 M_DD). d, h Serum IGF-1 and IGFB3 of animals at day 56 in facility 2. One-way ANOVA followed by Tukey’s multiple comparison analyses (GM15 mice: 9 F, 9 M_BD, 10 M_DD; SPF mice: 10 F, 12 M_BD, 12 M_DD; Oligo-MM12 mice: 9 F, 8 M_BD, 9 M_DD). *P < 0.05, **P < 0.01, ***P < 0.001, ****P < 0.0001. Source data are provided as a Source Data file.

