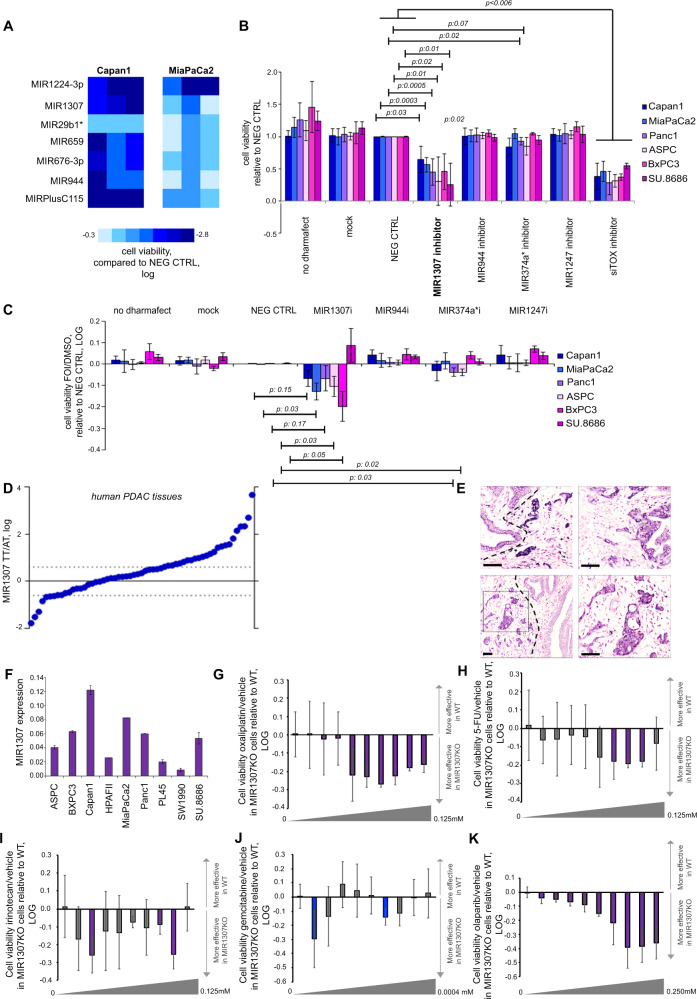
Fig. 1. MIR1307 inhibition sensitizes PDAC cells to FOI chemotherapy in vitro and is expressed by PDAC cells in two independent cohorts of human pancreatic tissues.
A Capan1 and MiaPaca2 cells were screened against a library of MIR inhibitors in high-throughput. Cells were reverse transfected with LNA MIR inhibitors (Exiqon) for 48 h followed by FOI treatment for 72 h before assessing cell viability by CellTiter-Blue assay. Each square indicates logarithmic value of the mean of cell viability normalized to averaged negative controls (N = 3), with colour code indicating the degree of change in cell viability. Only miRNA inhibitors which enhanced chemosensitivity by >30% (p < 0.001) in both the cell lines are shown. B Validation of selected HTS hits was performed in a panel of PDAC cell lines with different inhibitory probes (mirVana microRNA inhibitors, ThermoFisher Scientific) following the same protocol used for HTS. Cells were transfected with the indicated probes and then treated with FOI for 72 h. Bars indicate mean and standard deviation (SD) of five replicates. p values from two-sided t-test are reported. C PDAC cell lines were transfected with MIR inhibitors mirVana microRNA inhibitors, ThermoFisher Scientific) while they were treated with DMSO or FOI for 48 h. Bars indicated the LOG value of the ratio between FOI and DMSO and are presented normalized to NEG CTRL. Bars below the 0 line indicate that cell viability was reduced by the MIR inhibitor in the FOI treated vs the DMSO treated cells, indicating specificity for chemotherapy. Bars indicate the mean and SD of five replicates. Values from two-sided t-test are reported. D MIR1307 expression was assessed by Taqman assay in the tumour (TT) and adjacent tissue (AT) of 59 human PDAC samples (cohort 1). Dots represent log of the ratio between the expression in TT and that in AT for each patient. Dashed lines indicate TT > AT fold change >1.3. E MIR1307 was assessed by in situ hybridization in FFPE tissue from human resected PDAC. Representative pictures of four different cases of PDAC. Bars indicate 100 μm. In the bottom left quadrant, it is possible to observe positive epithelial cancer cells (black square) and negative normal ducts (right of the dashed line). F MIR1307 expression was assessed in human PDAC cell lines by Taqman assay. Bars represent the mean and SD of three replicates. G MIR1307KO and WT MiaPaca2 cells were treated with oxaliplatin (scalar concentrations as indicated in the figure) or vehicle for 48 h. Bars represent the LOG value of the ratio between drug and vehicle and are presented normalized to WT. Bars below the 0 line indicate that the reduction in cell viability was increased in MIR1307KO cells. Purple bars indicate statistically significance (p < 0.05). Bars indicate mean and SD of five replicates. Cell viability was reduced by 75% at the highest dose in WT. H 5-Fluorouracil (see above). Cell viability was reduced by 69% at the highest dose in WT. Bars indicate mean and SD of five replicates. I Irinotecan (see above). Cell viability was reduced by 93% at the highest dose in WT. Bars indicate mean and SD of five replicates. J Gemcitabine (see above). Cell viability was reduced by 60% at the highest dose in WT. Bars indicate the mean and SD of five replicates. K Olaparib (see above). Cell viability was reduced by 50% at the highest dose in WT.

