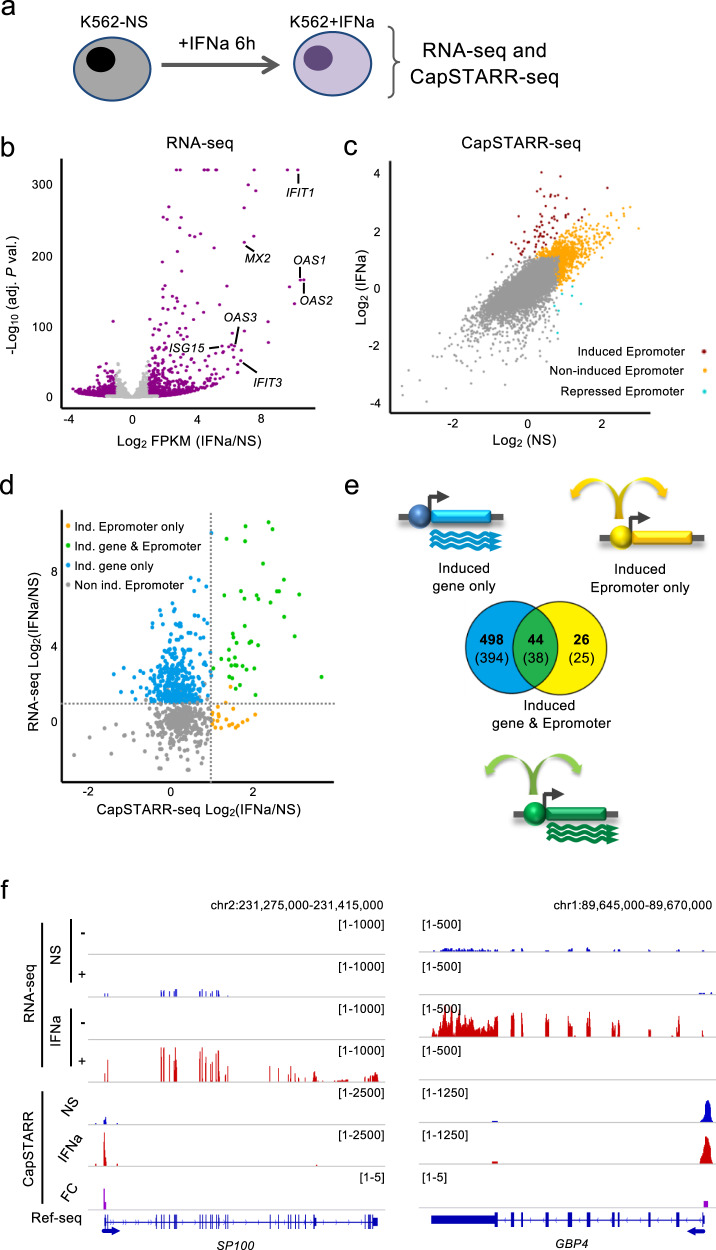
Fig. 1. Comparison of RNA-seq and CapSTARR-seq in non-stimulated and IFNa-stimulated K562 cells.
a Experimental approach to assess gene expression and enhancer activity of human promoters in non-stimulated (K562-NS) and IFNa-stimulated (K562 + IFNa) K562 cells. b Volcano plot of RNA-seq data in K562. The data plotted is the fold-change (FC) K562 + IFNa over K562-NS (log2 scale) of the Fragment per Kilobase per Million (FPKM) and the adjusted (adj.) P-value (−log10 scale). Genes significantly regulated (adj. P-val. < 0.001) are highlighted in purple. Some typical ISGs are indicated. c Scatter plot showing the CapSTARR-seq signal in K562-NS and K562 + IFNa. The data plotted is the CapSTARR-seq signal over the input (log2 scale). IFNa-induced Epromoters (brown), non-induced Epromoters (yellow), and repressed Epromoters (cyan) are highlighted. d Scatter-plot of RNA-seq and CapSTARR-seq signals, displaying only IFNa-induced genes or genes harboring an Epromoter. The data plotted is the RNA-seq and the CapSTARR-seq fold-change of K562 + IFNa over K562-NS (log2 scale). The different categories of genes in function of the IFNa response are indicated. Dot lines indicated a fold-change of 2. e Venn diagram showing the overlap between significantly induced genes and induced Epromoters. The number of promoters (bold) and the associated genes (under brackets) is shown. Note that some genes can be associated with multiple categories due to the presence of alternative promoters. f Examples of IFNa-induced genes with induced and non-induced Epromoters. The genomic tracks show the RNA-seq and CapSTARR-seq signal in non-stimulated (blue), IFNa-stimulated (red) K562 cells and the fold-change (purple). Positive and negative signs indicate the RNA-seq signal on the sense and anti-sense strands, respectively. Arrows indicate the orientation of the gene transcripts.

