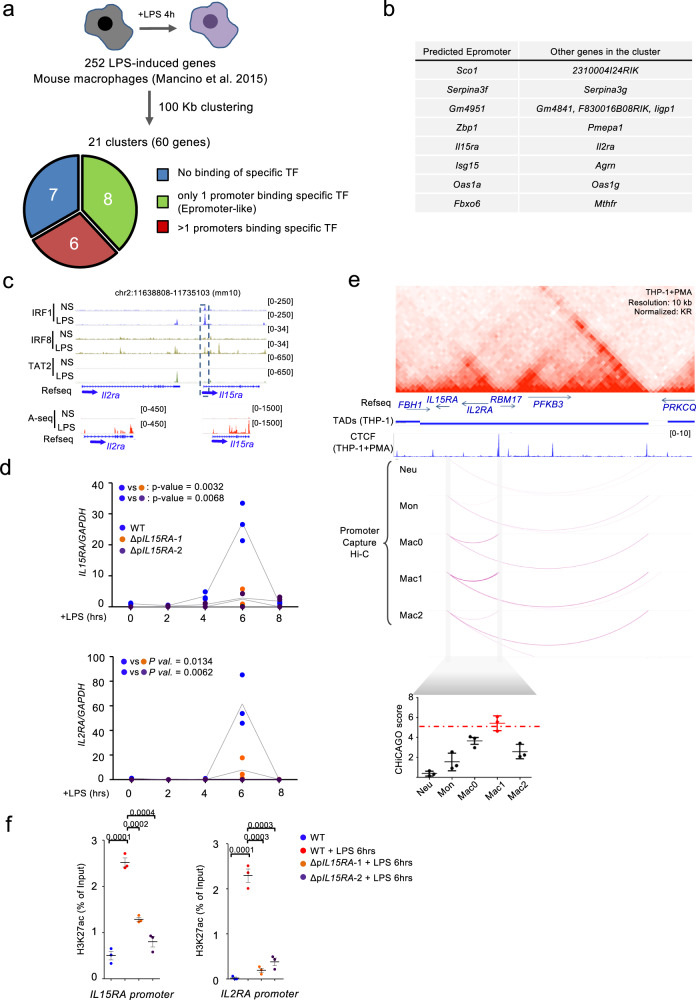
Fig. 6. Epromoter-like clusters identification and validation of enhancer activity in LPS stimulated macrophages.
a Schematic description of the clustering of the Lipopolysaccharide (LPS) induced genes in the mouse macrophages and pie-chart with the proportion of promoters that are bound by none (blue), 1 (green) or more than one (red) of the transcription factors (TFs) IRF1, IRF8 and STAT2, using data from Mancino et al.29. LPS induced genes in the mouse macrophages were clustered together if at least two of their promoters were located within less than 100 kilobases (kb). b Table showing the list of the 8 LPS-induced clusters with putative Epromoter elements as defined in a. c Genomic tracks centered on the mouse Il15ra/Il2ra cluster and showing the IRF1 (blue), IRF8 (bright olive) and STAT2 (green) ChIP-seq signal as well as the RNA-seq in unstimulated (NS) and after 4 h of LPS stimulation (LPS) of mouse macrophages. d qPCR analysis of gene expression of IL15RA and IL2RA genes in wild-type (blue) and ΔpIL15RA mutants 1 (orange) and 2 (purple) of in vitro differentiated THP-1 macrophages in unstimulated and at different intervals of time of LPS stimulation. Values represent the relative expression levels as compared to the unstimulated conditions and normalized by the GAPDH housekeeping gene. Points indicate values of n = 3 independent experiments and the line in gray present the mean of the values. P-values were calculated using Two-Way ANOVA test. e Top panel: genomic tracks showing Hi-C triangular matrix (resolution at 10 kb, Knight-Ruiz (KR) normalized) and ChIP-seq CTCF signal in in vitro differentiated human THP-1 macrophages. Topological Associated Domains (TADs) from THP-1 cells82. Middle panel: DNA interactions detected by CHiCAGO at the IL15RA from Promoter Capture Hi-C from Javierre et al.36, in human primary neutrophils (Neu), monocytes (Mon), in vitro differentiated macrophages unstimulated (Mac0), stimulated with LPS (Mac1) or with IL-13 (Mac2). Bottom panel: scatter plot showing the mean +/− s.d. of the CHiCAGO score of the three interactions between IL15RA to the three bins surrounding the CTCF site downstream IL2RA in addition to a red line indicating the threshold. The data was taken from Phanstiel et al.35. f H3K27ac ChIP-qPCR on IL15RA and IL2RA promoters in the wild-type NS (in blue) and in the wild-type and ΔpIL15RA mutants 1 and 2 of in vitro differentiated THP-1 macrophages upon 6 h of stimulation with LPS in red, orange and purple, respectively. Points indicate values of n = 3 independent experiments and the scatter plots shows the mean of values +/− s.d. P-values were calculated by two-sided Student’s t-test.

