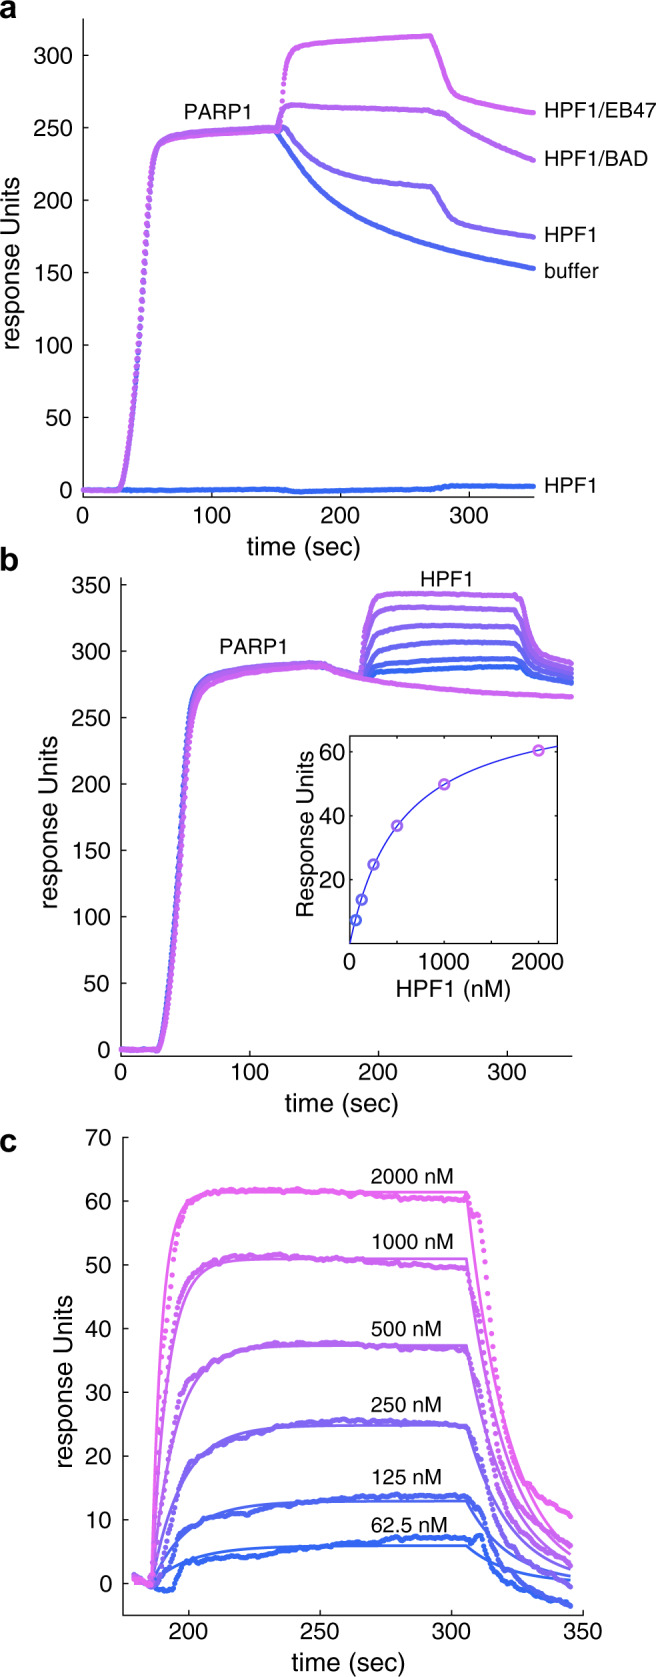
Fig. 3. Kinetics of HPF1 interaction with the PARP1/DNA complex.

a A DNA SSB was immobilized on a biosensor chip using streptavidin/biotin capture. PARP1 (40 nM) was flowed over the chip until near saturation, thus forming a PARP1/DNA complex. The surface was then immediately exposed to the following solutions: buffer, HPF1, HPF1 with BAD, or HPF1 with EB47. HPF1 alone did not interact with the DNA SSB surface. b HPF1 was passed over the PARP1/DNA complex at the following concentrations: 0 (buffer only), 62.5, 125, 250, 500, 1000, and 2000 nM. In these experiments, the buffer was supplemented with 5 µM EB47 to provide a more stable baseline during the PARP1 dissociation phase. The inset plots the plateau value achieved at each HPF1 concentration, and the line indicates the fit for a 1:1 binding model (KD of 550 nM). c The association and dissociation phases of the HPF1 injections from panel b were fit to a 1:1 binding model, yielding a rate of association (ka) of 1 × 10⁵ M−1second (s)−1 and a rate of dissociation (kd) of 0.06 s−1 (corresponding to KD of 540 nM). These experiments were performed three times.
