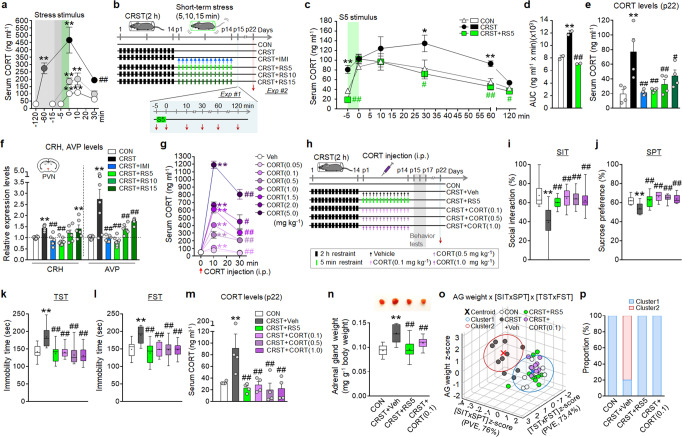
Fig. 2. RS5 or low-dose CORT treatment normalizes stress-induced dysregulation of the HPA axis.
a Serum CORT levels in mice treated with 5-min, 15-min, 60-min, and 120-min restraint (n = 8–9 animals per group). b–f Experimental design (b). Time course of serum CORT levels in the indicated groups after exposure to a single 5-min restraint (S5) (Exp #1) (c), and the area under the curve (AUC) between −5 min and 120 min (d) (n = 7–8 animals per group). Basal serum CORT levels (e), and transcripts levels of CRH and AVP in the PVN (f) for the indicated groups (Exp #2) (n = 7–8 animals per group). g Changes in serum CORT levels in mice after injection with CORT injection (0.05, 0.1, 0.5, 1.0, 1.5, 2.0, 5.0 mg kg−1, i.p.) (n = 8-9 animals per group). h–p Experimental design (h). CORT was injected (0.1, 0.5, 1.0 mg kg−1 per day, i.p.) for 14 days in CRST mice. The % time of social interaction in the SIT (i), % sucrose-preference in the SPT (j), and immobility time in the TST (k) and FST (l) for the indicated groups (n = 10 animals per group). Basal serum CORT levels (n = 8 animals per group) (m) and adrenal gland (AG) weight (n = 10 animals per group) (n) of the indicated groups on post-stress day 22. K-means clustering of individuals in the [AG weight] x [SIT × SPT] × [TST × FST] matrix (o) and % composition of each group in the clusters (p). PCA was used for dimensional reduction of the SIT and SPT components (PVE; 76.0%) and the TST and FST components (PVE; 73.4%). Data were mean ± SEM. Gray circles represent individual data points. *, the difference compared to control; #, the difference compared to CRST. *, #, p < 0.05; **, ##, p < 0.01 (One-way ANOVA followed by Newman–Keuls post hoc test). See Supplementary Data 4 for statistical details.

