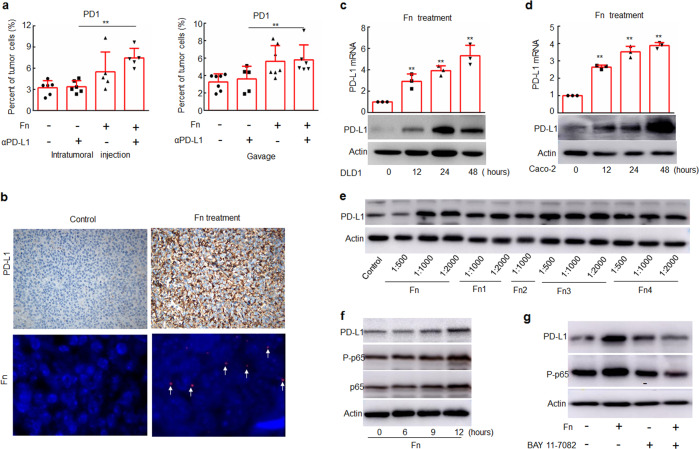
Fig. 4.
F. nucleatum induces the expression of PD-1 and PD-L1. a Flow cytometry was used to detect the expression of PD-1 in tumor tissues from mice treated with F. nucleatum and/or an anti-PD-L1 mAb. One-way ANOVA and Bonferroni’s multiple comparison test. b The protein levels of PD-L1 were detected by IHC, and F. nucleatum was detected by FISH in tumor tissue samples from mice. Brown staining in IHC and red staining in FISH (white arrows) indicate positive staining. c, d DLD1 and Caco-2 cells were treated with Fn (1:1000) for different time course, and the mRNA and protein levels of PD-L1 were detected by RT-PCR and Western blotting, respectively. Student’s t-test. e DLD1 cells were treated with different dilutions of different Fn isolates obtained from CRC patients. f DLD1 cells were treated with Fn (1:1000) for different time course. g DLD1 cells were treated with Fn (1:1000) and/or 5 μM BAY 11–7082 for 24 h. The expression of the indicated proteins was detected by Western blotting. Actin was used as a loading control. Bars represent s.d. of at least three experiments. *P < 0.05; **P < 0.01. Fn, F. nucleatum. NS, no significant difference

