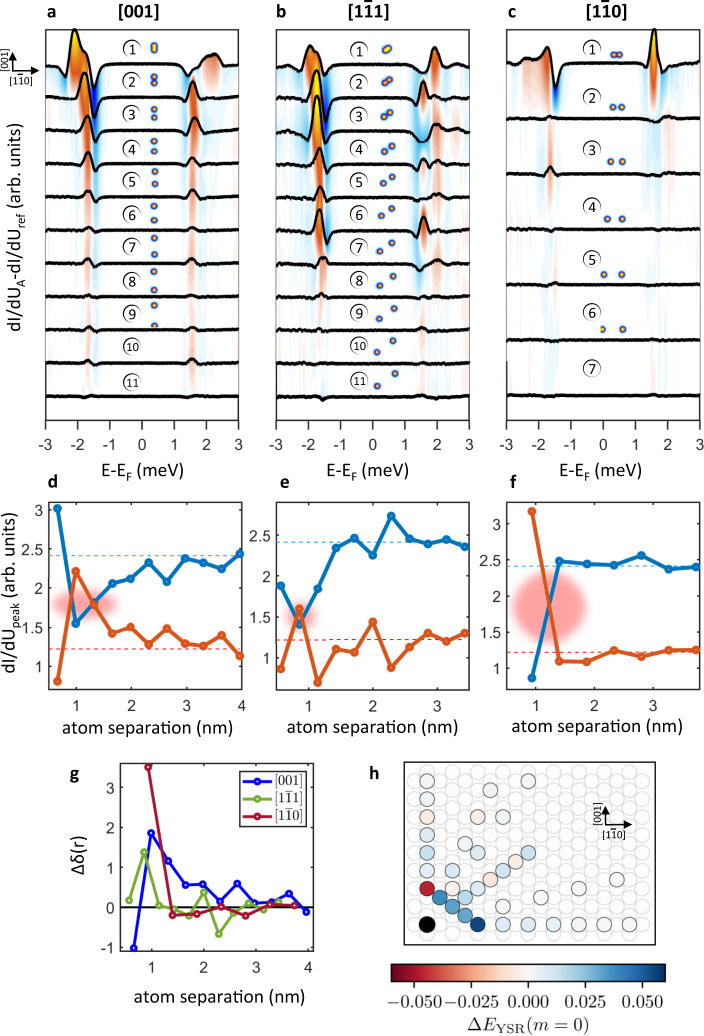
Fig. 3. Distance dependence of the YSR energy spectrum.
a–c STS taken on atom A subtracted by the signal on the isolated Cr atom. Spectra are shown for three different directions and several distances, the number in each panel corresponding to the number of discrete steps. d–f In-gap peak maximum for positive (red) and negative (blue) energies as a function of the distance between the adatoms. The dashed lines show the isolated atom intensities. Red shaded areas highlight the occurrence of a quantum phase transition from a free-spin to a screened-spin regime. g Comparison of spectral weight redistribution δ along distinct directions and at different distances. Zero corresponds to the isolated adatom case. h First-principles calculations of the shift of the YSR energies of the z2-derived orbital with respect to the single adatom YSR energies. The black dot illustrates the fixed atom A, while the colored positions represent atom B and therefore the formed dimer configuration. Adsorption site positions on the Nb lattice correspond to the cases measured experimentally. The color code indicates the calculated shift in YSR energy for the respective Cr dimers.

