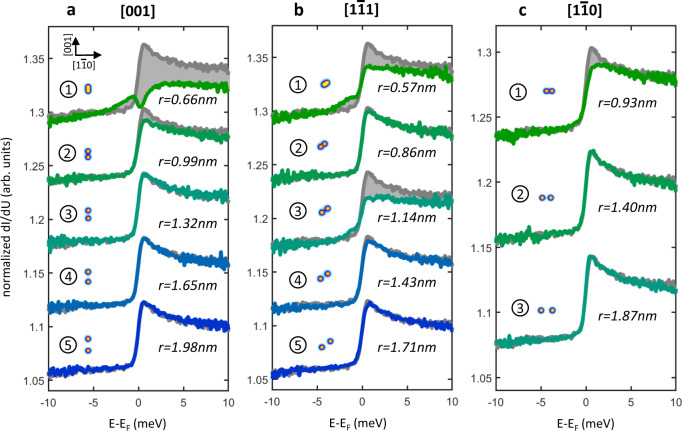
Fig. 4. Spectroscopy in the metallic regime.
a–c dI/dU signals over atom A with increas- ing distance of atom B starting with step 1 at next-nearest-neighbor positions for three different crystallographic directions. The signal of the isolated Cr adatom is shown in gray for each spectrum as a reference. An external out of plane magnetic field of 1 T was applied to fully suppress superconductivity. Stabilization parameters: −10 mV; 3 nA. Insets: topographic images of the corresponding dimer shown in equal scale.

