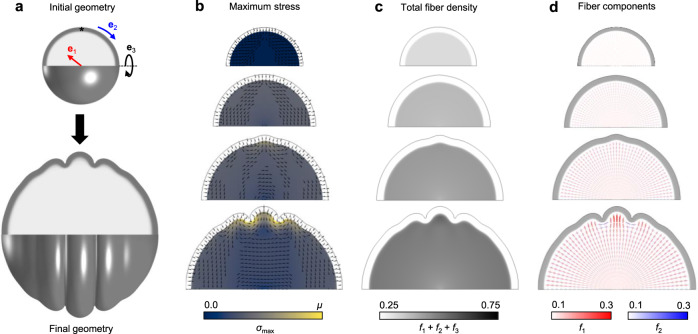
Fig. 2. Cortical folding induces stereotyped fiber organization beneath gyri and sulci.
a Model geometry before and after folding. For the axisymmetric model, material coordinate directions are defined in radial (e1), circumferential-tangential (e2), and axisymmetric-tangential directions (e3), and can be followed over the course of deformation. The asterisk denotes the location of a symmetry-breaking perturbation. b–d Evolution of maximum stress (b), total fiber density (c), and directional fiber components (d) in the subplate over the course of folding. From top to bottom, simulation time T = 0, 0.5, 0.75, 1. In b, colormap indicates the magnitude of maximum Cauchy stress (σmax) at each point in the subcortical layer, ranging from 0 to μ = 300 Pa (shear modulus of tissue, as defined in Methods). Tick marks indicate the maximum stress direction, with no visible tick marks indicating the e3 direction. In c, greyscale indicates the magnitude of total fiber density, where f1, f2, f3, indicate the fiber volume fraction in directions e1, e2, e3, respectively. In d, crosses (+) are used to visualize local fiber volume fraction in terms of radial and (circumferential) tangential directions. Magnitude of fiber volume fraction in these specific directions is represented by color (radial fibers in red, tangential fibers in blue), such that a dark red region indicates increased radial fibers per unit volume, dark blue indicates increased tangential fibers per unit volume, and light color indicates relatively low fiber volume fraction.

