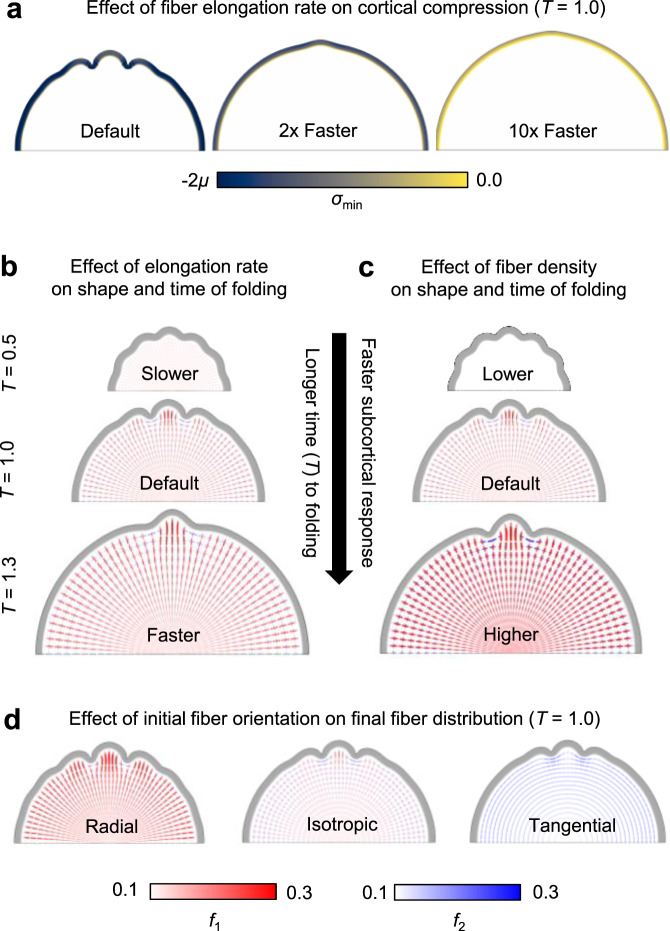
Fig. 3. Effect of initial fiber properties on cortical folding and final fiber organization.
a Increasing the rate of stress-dependent fiber elongation results in reduced cortical compression and folding at the final simulation time, T = 1. From left to right, results are shown for nondimensionalized fiber response ratios R = 60 (default), 120, 600. Colormap indicates the magnitude of minimum Cauchy stress (σmin) at each point in the cortical layer, over a compressive stress range of −600 Pa to 0. (μ = 300 Pa represents shear modulus of tissue, as defined in Methods.) No folding is observed in models with R ≥ 600. b–c Rate of fiber elongation and initial fiber density alter the time course and morphology of cortical folding. From top to bottom in b, results are shown for nondimensionalized fiber response ratios R = 30, 60 (default), 120. From top to bottom in c, results are shown for total fiber volume fractions f1,0 + f2,0 + f3,0 = 0.16, 0.32 (default), 0.64. For each case shown, the selected simulation time (T) was chosen to illustrate morphology and fiber volume fractions at a similar stage of fold maturity. d Initial fiber organization produces subtle influence on final fold morphology but similar subcortical fiber organization with respect to gyri and sulci. In b–d, crosses (+) are used to visualize local fiber volume fraction in terms of radial (f1) and tangential (f2) directions. Magnitude of fiber volume fraction in specific directions is represented by color (radial fibers in red, tangential fibers in blue), such that a dark red region indicates increased radial fibers per unit volume, dark blue indicates increased tangential fibers per unit volume, and light color indicates relatively low fiber volume fraction.

