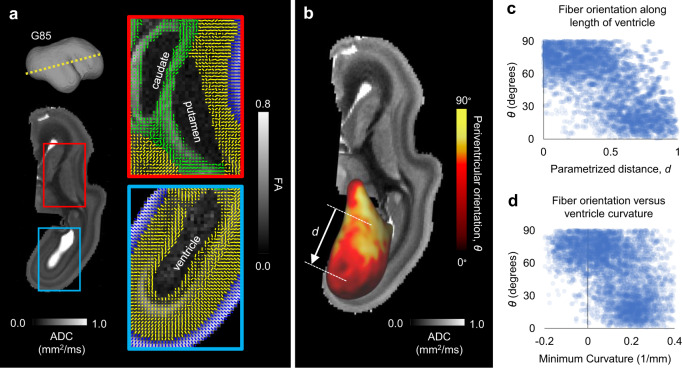
Fig. 7. Primary anisotropy orientation near the ventricular surface in the G85 rhesus macaque brain.
a Primary eigenvector directions (tick marks) based on high-resolution DTI of the rhesus macaque (Macaca mulatta) brain at G85, at the slice indicated by the yellow dotted line. An apparent diffusion coefficient (ADC) map is shown to visualize deep gray matter structures. Red and blue insets illustrate primary eigenvector directions surrounding solid internal brain structures (red) and the fluid-filled lateral ventricle (blue), with fractional anisotropy (FA) maps as an underlay. b The periventricular orientation angle, θ, was calculated and projected to the ventricular surface following the same process described in Fig. 5a. ADC map is again shown to visualize surrounding structures. c For each vertex on the ventricular surface, parameterized distance (d) from the approximate center of the long axis of the ventricle was calculated, ranging from 0 to 1. Scatter plot illustrates the relationship between parameterized distance from center, d, and θ. d Minimum curvatures were also calculated at each point, ranging from approximately zero near the center of the long axis of the ventricle to approximately 0.2 mm−1 near the end of the ventricle. Scatter plot illustrates the relationship between minimum curvature and θ. Data are presented for the only G85 hemisphere investigated in this study. Data points in panels c–d represent the values at individual vertices along the ventricular surface in panel b (5814 unique vertices).

