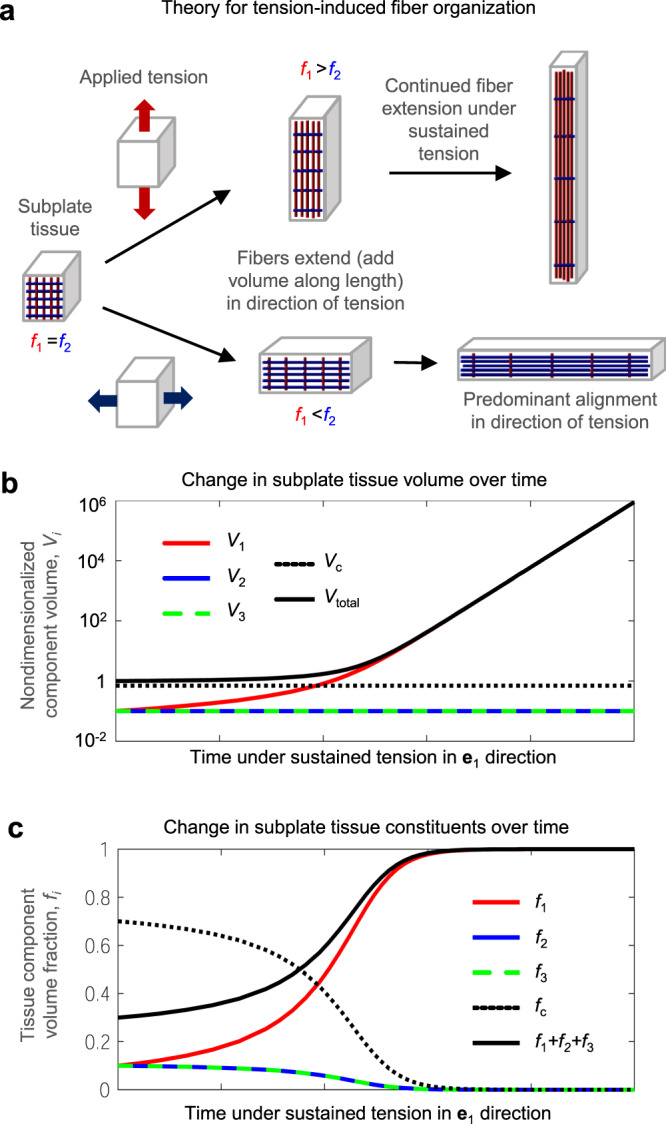
Fig. 8. Theoretical growth and remodeling in response to sustained tension.

a Schematic illustration of tissue elements with embedded fibers in initial configuration (left), after a short period of stretch and fiber elongation (middle), and after an extended period of stretch and fiber elongation (right). Tissue blocks are not shown to scale since volume increase becomes dramatic over an extended period of stretch. Theoretical behavior of a tissue element subjected to sustained tension in direction e1 as time approaches infinity is described in b–c. b Volume associated with each tissue component as a function of time, starting from a nondimensionalized total tissue volume (Vtotal) of 1. V1 represents volume associated with fibers aligned in the direction of tension (e1), while V2 and V3 represent the volume associated with fibers perpendicular to tension (e2 and e3), and Vc represents the volume associated with cells and extracellular matrix. Vertical axis is log scaled to facilitate visualization, as total volume begins to increase dramatically (approximately exponentially) at later time points. c Volume fraction of each tissue component as a function of time, starting from an initial fiber volume fraction of 10% in each direction (f1 = f2 = f3 = 0.1). When tension and fiber growth are allowed to continue indefinitely, fiber volume fraction approaches 1 while the volume fraction of non-fiber components (fc) approaches 0.
