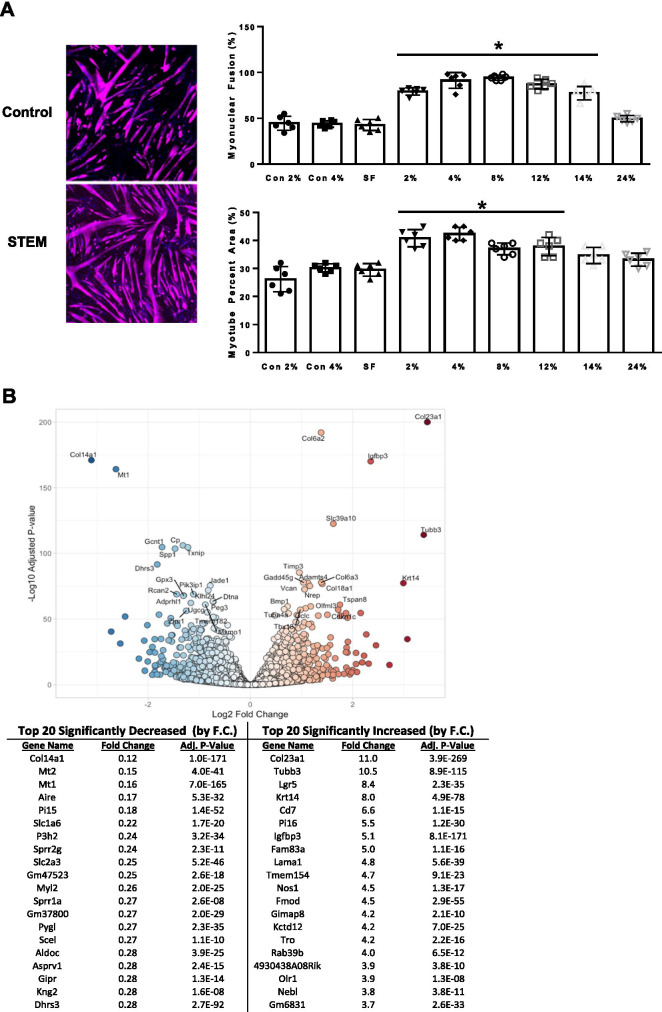
Fig. 8.
STEM effects on C2C12 myotube fusion, size, and myotube transcriptional signature: panels represent A quantification of controls (2% and 4% horse serum) and 2–24% STEM-treated C2C12 myotubes for myonuclear fusion (%) and myotube size. Representative images for horse serum and STEM for myonuclear fusion and myotube percent area. B Volcano plot and table of top significantly increased and decreased genes in STEM-treated myotubes compared to horse serum (control). SF denotes serum free media. Results are mean with standard error of the mean, one-way ANOVA. * = different from groups not under solid line

