Figure 5.
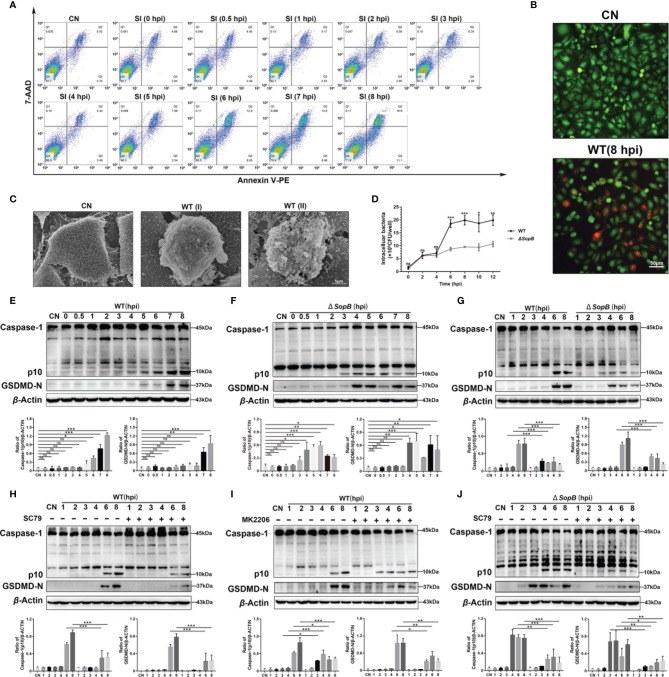
SopB-mediated Akt phosphorylation delayed pyroptosis. (A) The proportion of apoptotic cells within 8 h after infection with WT S. Infantis was detected using flow cytometry. (B) Calcein-AM/PI was used to evaluate cell membrane permeability after 8 h of infection with WT S. Infantis. Green: Calcein-AM; Red: PI. (C) Observation of the apical surface of Caco-2 cell monolayer ultrastructure using scanning electron microscopy. WT (I) (6 hpi) and WT (II) (8 hpi) showed that the WT S. Infantis–infected cell was bacteria-laden, which were extruded from the monolayer. (D) Detection of intracellular bacterial load using the gentamicin protection assay at 0, 2, 4, 6, 8, 10, and 12 hpi after infection (Black curve: WT S. Infantis; Gray curve: SopB mutant). (E–J) Western blot analysis of Caspase-1 and GSDMD-N protein levels after infection with WT S. Infantis or the SopB mutant within 8 h. (E) Infection with WT S. Infantis; (F) infection with the SopB mutant; (G) comparison of WT S. Infantis and the SopB mutant; (H) infection with WT S. Infantis in the presence of SC79; (I) infection with WT S. Infantis in the presence of MK2206; (J) infection with the SopB mutant infection in the presence of SC79. Data were presented as the mean ± SEM from three independent experiments (n = 3). *P < 0.05, **P < 0.01, ***P < 0.001. CN, control; SI, S. Infantis. ns, no significant difference.

