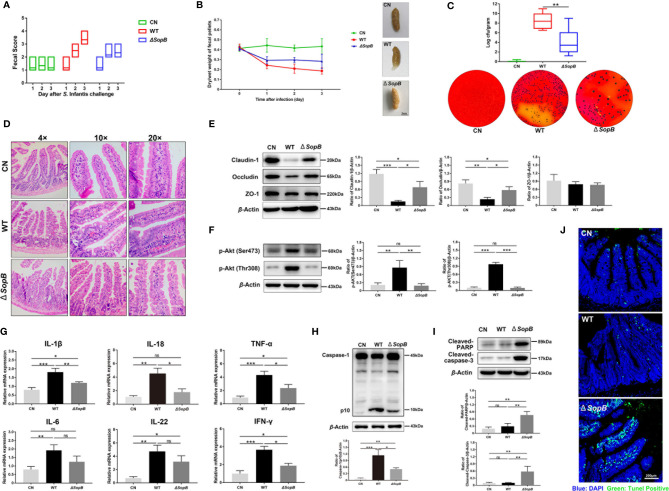
Figure 6.
WT S. Infantis caused more severe intestinal inflammatory damage to the C57BL/6 mice gut than the ΔSopB mutant. (A) The fecal score curve of mice in three groups after Salmonella infection. The fecal status of mice was scored daily. (B) Results of the dry/wet weight ratio of feces. The starting day of the experiment was considered as day 0 (24 h after streptomycin gavage). Three representative feces images of each group are shown on the right side of the curve. (C) Quantification of fecal bacterial burdens on day 3. Three representative plots of bacterial colonies images in each group are below the curve. (D) Ileum representative photomicrographs of sections stained with H&E. (E, F) Western blot analysis of Claudin-1, Occludin, p-Akt (Ser473), and p-Akt (Thr308) protein levels of three groups. (G) Expression of IL-1β, IL-18, IL-6, IL-22, TNF-α, and IFN-γ mRNA in ileal tissues. (H, I) Western blot analysis of Caspase-1, Cleaved-caspase-3, and Cleaved-PARP protein levels of three groups. (J) The representative images of TUNEL fluorescence staining in ileum tissue pathological sections. Blue: DAPI; Green: TUNEL positive cells. Data were presented as mean ± SEM. (n = 6). Data were presented as the mean ± SEM from three independent experiments (n = 3). *P < 0.05, **P < 0.01, ***P < 0.001. CN, control. ns, no significant difference.

