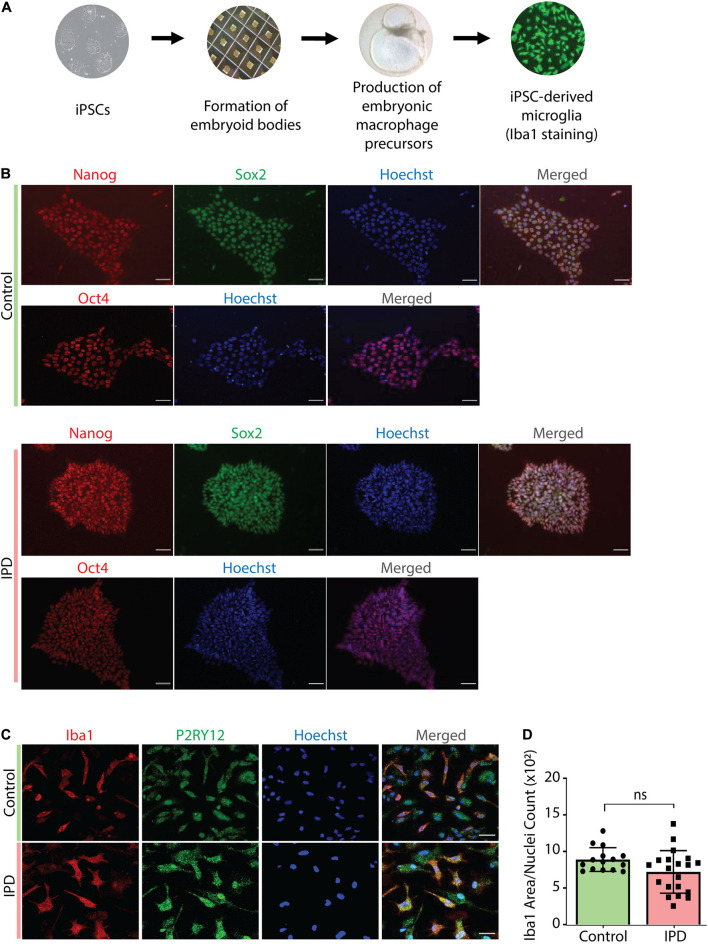
FIGURE 2.
Characterization of cellular models used in the study. (A) Overview of the protocol used to derive microglia from iPSCs. (B) Immunostaining with Nanog, Sox-2 and Oct-4, coupled with nuclear staining with Hoechst, confirmed the iPSC identity of our cells. Scale bar, 50 μm. (C) Terminally differentiated microglia were confirmed to express the microglia-specific markers Iba1 and P2RY12. Scale bar, 30 μm. (D) Quantification of data from (C); no difference in Iba1 protein levels (Iba1 area was normalized for nuclei count); IPD, idiopathic PD; CTR, healthy control.

