FIGURE 3.
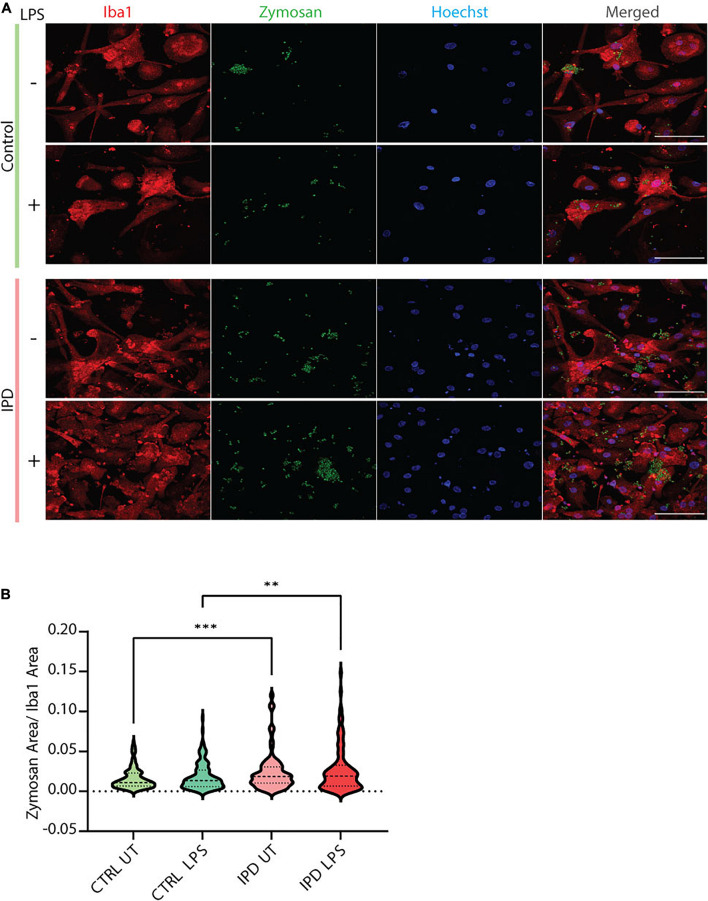
Functional assessment of iPSC-derived microglia. (A) Representative immunostaining showing the functional ability of cultured control and IPD microglia treated with Zymosan bioparticles. Scale bar, 50 μm. (B) Quantification of data from (A); IPD microglia have higher phagocytic capacity (Zymosan area was normalized for Iba1 area) compared to control cells. ∗∗p < 0.01; ∗∗∗p < 0.001; IPD, idiopathic PD; CTRL, healthy control.

