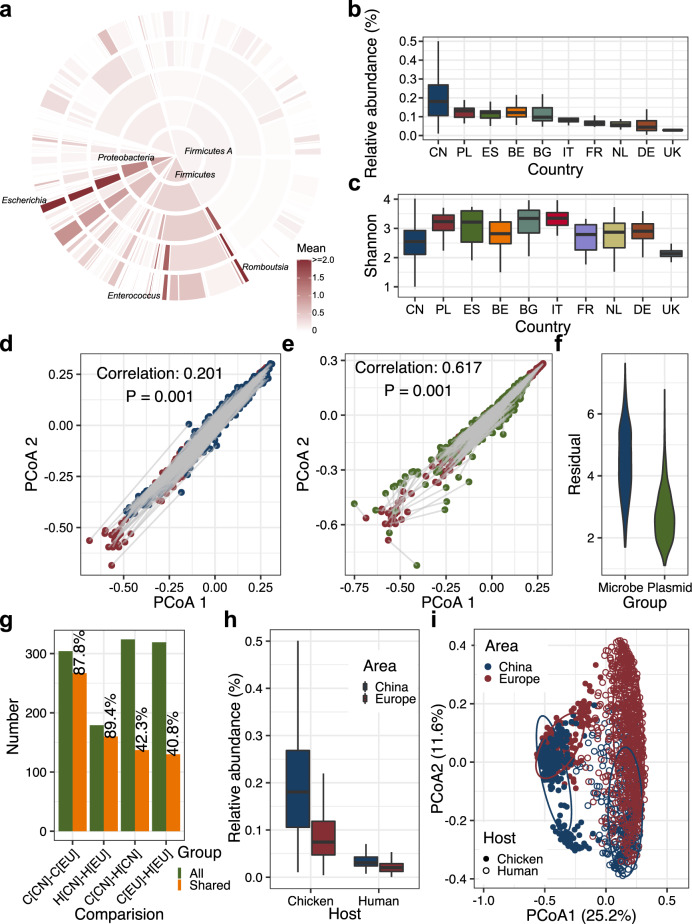
Fig. 4. Profiling the antibiotic resistome in the chicken gut microbiome.
a Number of ARGs in MAGs at different taxonomic levels. The inner to outer portions represent the phylum level to the genus level. The color represents the mean values of ARGs in specific taxa. b Relative abundance of ARGs in samples from different countries. c Shannon index of ARGs in samples from different countries. d Procrustes analyses of the correlation between the microbial abundances and the ARG abundances. Red dots: ARG abundances; blue dots: microbial abundances. e Procrustes analysis of the correlation between the plasmid and ARG abundances. Red dots: ARG abundances; green dots: plasmid abundances. f Violin plot of the residuals from the Procrustes analyses in d, e. g Proportion of ARGs shared among microbiomes. C[CN], C[EU], H[CN], and H[EU] denote Chinese chicken samples, European chicken samples, Chinese human samples, and European human samples, respectively. h Relative abundance of ARGs in the chicken and human gut microbiomes. i Principal coordinate analysis (PCoA) based on the Bray–Curtis distance of the ARG abundance in chickens and humans from China and Europe. CN China, UK United Kingdom, DE Germany, BG Bulgaria, IT Italy, FR France, ES Spain, PL Poland, BE Belgium, NL Netherlands.

