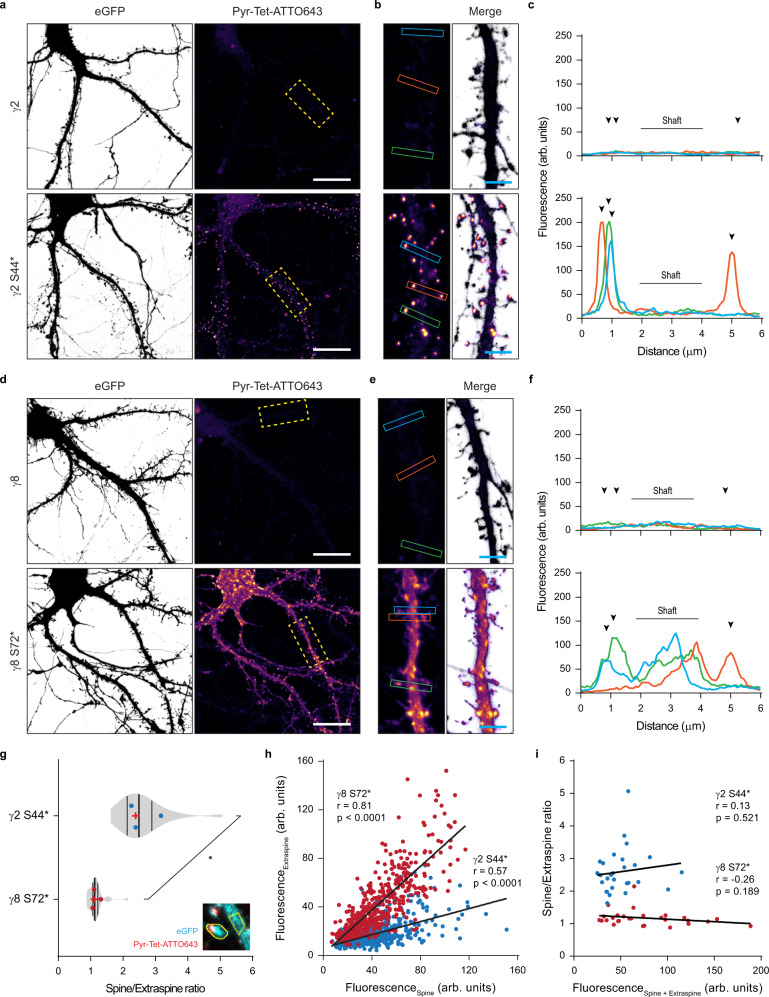
Fig. 3. Distinct dendritic surface distribution of γ2 S44* and γ8 S72* in dissociated neurons.
a–d Representative confocal images of fixed dissociated hippocampal neurons co-expressing eGFP, Tet3G/tRNAPyl and a pTRE3G-BI PylRS/γ2 (upper panel), pTRE3G-BI PylRS/γ2 S44* (lower panel), d pTRE3G-BI PylRS/γ8 (upper panel), or pTRE3G-BI PylRS/γ8 S72* (lower panel) in the presence of 250 µM TCO*A and 100 ng mL−1 doxycycline live stained with 0.5 µM Pyr-Tet-ATTO643. b, d 20 µm and b, e 4 μm (magnified images). c, f Line scan measurements of Pyr-Tet-ATTO643 across spines and dendritic shaft based on eGFP signal represented in b and e. g Average spine to extraspine intensity ratio of the ncAA staining indicating a spine enrichment of 2.60 ± 0.69 folds for γ2 S44* (blue), and of only 1.17 ± 0.25 fold for γ8 S72* (red). Statistical significance was analyzed using a two-tailed unpaired Welch’s t test; *p < 0.05. h Plot of all the analyzed spines fluorescent intensities as a function of the intensity in a corresponding neighboring equivalent extraspine area in the dendrite for γ2 S44* (blue) and γ8 S72* (red) expressing neurons. The Pearson’s correlation coefficients are γ2 S44*: blue, r = 0.57, p < 0.0001, 872 spines; and, γ8 S72*: red, r = 0.81, p < 0.0001, 521 spines. i Plot of the average ratio per neuron of spine to extraspine intensities as a function of the sum of spine and extraspine intensities for γ2 S44* (blue, r = 0.13, p = 0.521) and γ8 S72*: and γ8 S72* (red, r = 0.−26, p = 0.189) expressing neurons. (g–i) Data relative to γ2 S44* and γ8 S72* pulled from 28 cells each from three independent biological replicates. All representative images are representative of three independent preparations. Source data are provided as a Source Data file.

