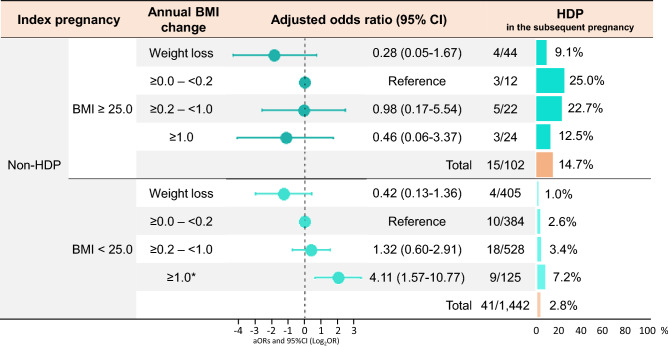
Figure 4.
Adjusted odds ratios for HDP in the subsequent pregnancy among those without the history of HDP in the index pregnancy. The multivariable models were adjusted for maternal age in the index pregnancy, pregnancy interval, and classified annual BMI change. Values on the left side of the graph are expressed as log2OR. The right side of the graph shows the incidence of HDP in the subsequent pregnancy according to the degree of annual BMI change. The number of HDP in the subsequent pregnancy/total number is also shown according to the degree of annual BMI change. BMI, body mass index; CI, confidence interval; HDP, hypertensive disorders in pregnancy.

