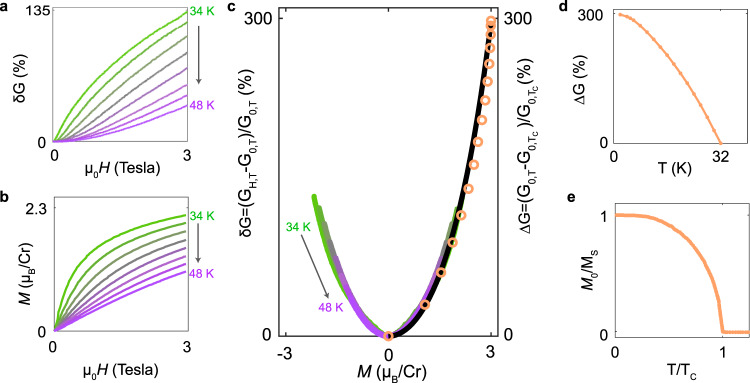
Fig. 3. Magnetization dependence of the tunneling magnetoconductance.
a Tunneling magnetoconductance of 7 layer device measured for T > Tc, as T is varied from 34 K to 48 K in 2 K steps (curves of the same color in panels b and c represent measurements taken at the same temperature). b Magnetic field dependence of the magnetization measured on bulk CrBr3 crystals. c: Magnetization dependence of tunneling magneto-conductance. Colored lines represent the magnetoconductance measured at different T > Tc, plotted as a function of the bulk magnetization measured at the same temperature. The orange open circles represent the relative change in conductance due to the increase in the spontaneous magnetization of CrBr3, measured for different T < Tc, obtained from the data shown in panels d and e. All data collapse on top of each other, indicating that the conductance is a function of the magnetization, i.e., it depends on H and T exclusively through M(H, T), throughout the entire T range investigated (i.e., from well below to well above TC). The black line is a fit based on the expression obtained from the spin-dependent Fowler–Nordheim tunneling model, under the assumption that the splitting between the spin up and down bands is proportional to the magnetization (see main text for details). d Temperature dependence of the relative conductance increase as T is lowered below TC, in the ferromagnetic state of CrBr3. e Spontaneous magnetization of CrBr3 calculated by XXZ model with anisotropic exchange interactions that -as shown in ref. 24- accurately reproduces the measured magnetization of atomically thin CrBr3 crystals.

