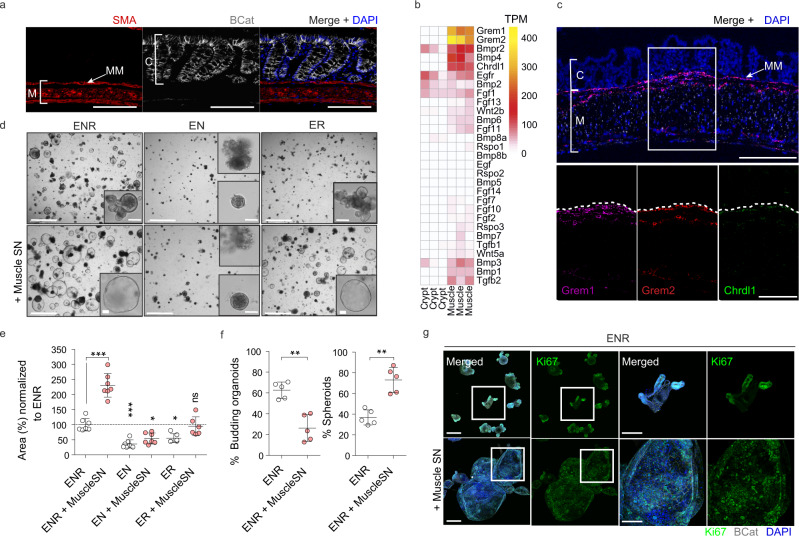
Fig. 1. Intestinal Smooth muscle expresses BMP antagonists that control epithelial behavior.
a Representative confocal maximum intensity projection of a transverse colon cut showing specific staining for muscle (M), SMA (Red), and crypts (C), βCatenin (βcat, Gray). Clear distinction among muscularis mucosa (MM) close to the crypts and the muscularis propria (circular and longitudinal smooth muscle) can be observed. Scale bar 100 µm. n = 4 mice. b Heatmap depicting gene expression levels in TPM (Transcripts per million) in crypts vs muscle intestinal samples. n = 3 biological replicates. c Representative confocal maximum intensity projections of fluorescence-coupled RNAscope showing BMP antagonists Grem1 in magenta, Grem2 in red, and Chrdl1 in green, expressed in smooth muscle cells. Scale bar 100 µm; 50 µm in the magnified image. n = 2 mice. d Representative bright-field pictures showing SI organoids morphological changes when exposed to muscle-derived factors (Day4). Control media ENR (EGF, NOGGIN, RSPO1), EN (no RSPO1) or ER (no NOGGIN) were used to assess SI organoids reliance on external growth factors. Scale 1250 µm; 100 µm in magnified image. e Graph shows SI organoids area in response to different media. Depicted average values normalized to ENR condition. n = 6 (for ER and ER + MuscleSN) to 7 (the rest) independently performed experiments. Each dot corresponds to the average of 2–3 wells/experiment. f Graphs represent the percentage of budding organoids or spheroids in response to ENR or ENR+ muscle supernatant (Muscle-SN). n = 5 independently performed experiments with 2–3 wells/experiment. g Representative maximum projection confocal images showing proliferative active cells (Ki67) in green and cell shape (βcat, gray) staining. Scale 200 µm, 100 µm in magnified image. n = 3 independent experiments. Numerical data are means ± SD. Data were analyzed by one-way ANOVA (F = 57.06, p < 0.0001) followed by Bonferroni’s multiple comparison test (ENR vs ENR + Muscle SN ***p < 0.001; ENR vs EN ***p < 0.001; ENR vs EN + Muscle SN *p < 0.05; ENR vs ER *p < 0.05; ENR vs ER + Muscle SN, ns, not significant.) (e) or by Mann–Whitney–test, two-tailed (**p = 0.0079 in both) (f). Source data are provided as a Source Data file.

