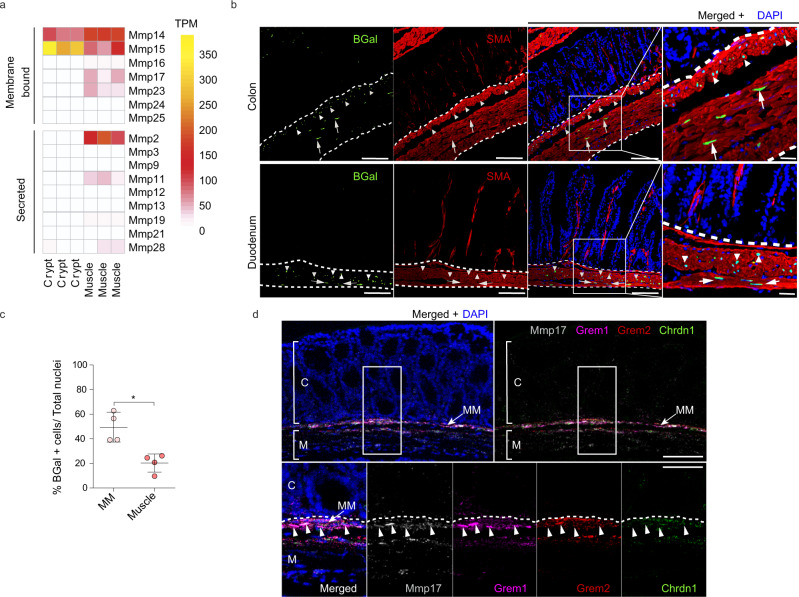
Fig. 2. Muscle-specific matrix metalloproteinase Mmp17 is enriched in the muscularis mucosa together with BMP antagonists expressing cells.
a Heatmap shows TPM levels of Matrix Metalloproteinases (MMPs) in crypts vs muscle. n = 3 biological replicates. b Representative confocal microscopy images showing active Mmp17 promoter (βGal staining, green) in positive SMA (red) muscle (white dashed line) stained in transverse intestinal sections of Mmp17± mice. Scale bar 100 µm; 20 µm in the magnified image. n = 3 animals. c. Graph shows quantification of the % number of βGal positive cells in muscularis mucosa (MM) vs circular and longitudinal muscle (Muscle) in colon samples. n = 3 biological replicates. Four images quantified. d Representative confocal maximal projections of fluorescence-coupled RNAscope showing Mmp17 (gray), and BMP antagonists (Grem1, magenta, Grem2, red and Chrdl1, green) co-expression in muscular cells (arrowheads). C, crypts, M, Muscle and MM, muscularis mucosa. Scale bar 100 µm; 50 µm in the magnified image. n = 2 independent experiments with 1–2 samples/genotype. Numerical data in (c) are means ± SD and was analyzed by Mann–Whitney test (two-sided, *p = 0.0286). Source data are provided as a Source Data file.

