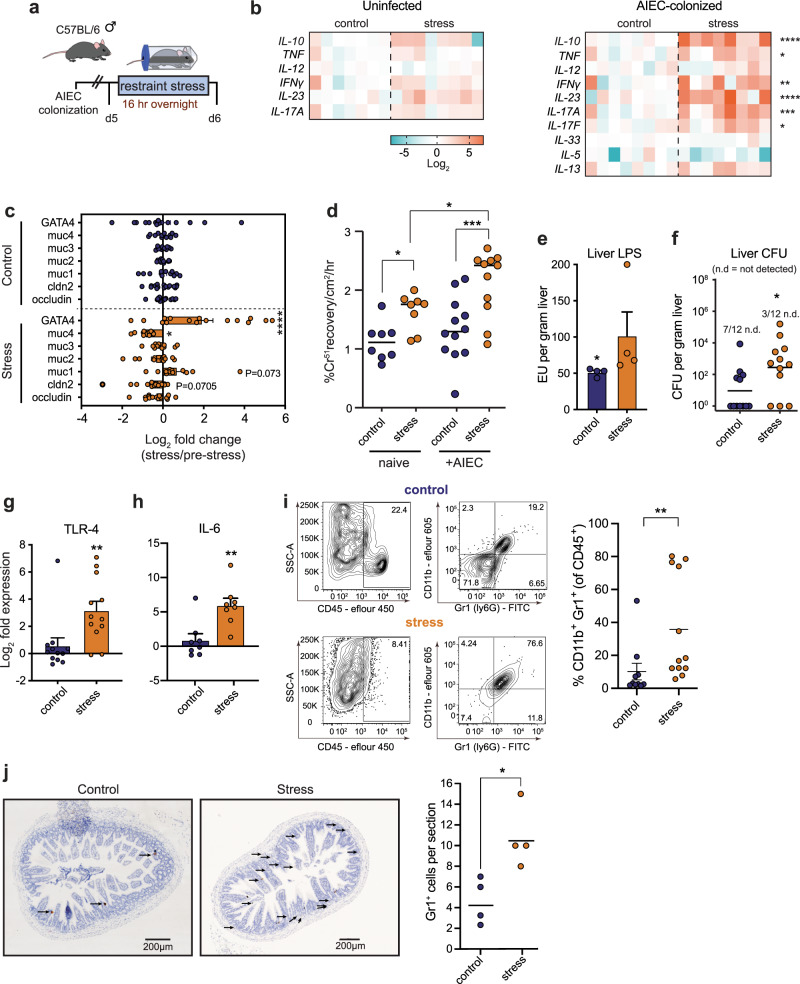
Fig. 3. Exposure to acute psychological stress impairs ileal barrier function and exposes mice to invasive microbes.
a Schematic representation of infection and stress protocol. b RT-qPCR analysis of cytokine expression of the ileum of naive starved (n = 7), naive stressed (n = 8), AIEC-colonized starved (n = 8), AIEC-colonized stressed (n = 8) samples. Significance was determined by a two-way ANOVA, not corrected for multiple comparisons, IL-10, p < 0.0001; TNF, p = 0.031; IFN-γ, p = 0.0032; IL-23, p < 0.0001; IL-17A, p = 0.0004; IL-17F, p = 0.0383. c RT-qPCR analysis of RNA expression for genes associated with barrier function in the ileum of AIEC-colonized starved and stressed mice. Significance was determined by a two-way ANOVA, not corrected for multiple comparisons (n = occludin (c16, s16); cldn2 (c16, s16); muc1 (c12, s12); muc2 (c12, s12); muc3 (c12, s12); muc4 (c12, s12);GATA4 (c16, s16)). GATA4, p < 0.0001; Muc4, p = 0.0294. d Paracellular permeability determined by chromium passage through a 1 cm ileal segment collected from naive (n = 8) or AIEC-colonized (n = 12) mice subjected to starvation or restraint stress. Significance was determined by a two-way ANOVA, not corrected for multiple comparisons, control (naive):stress (naive), p = 0.0362; control (infected):stress (infected), p = 0.0003; stress (naive):stress (infected), p = 0.0346. e Liver LPS concentration, represented as Endotoxin Units per gram tissue, was quantified within AIEC-colonized starved (n = 4) and stressed (n = 4) mice. Significance was determined by a two-tailed Mann–Whitney, p = 0.0286. f Bacterial burdens in the liver were enumerated in AIEC-colonized starved (n = 12) or stressed (n = 12) mice. Significance was determined by a two-tailed Mann–Whitney, p = 0.0240. g RT-qPCR analysis of TLR-4 RNA expression in the ileum of AIEC-colonized starved (n = 12) or stressed (n = 12) mice. Significance was determined by a two-tailed Mann–Whitney, p = 0.0056. h RT-qPCR analysis of IL-6 RNA expression in the ileum of AIEC-colonized starved (n = 8) or stressed (n = 8) mice. Significance was determined by a two-tailed Mann–Whitney, p = 0.0070. i Representative FACS plots of CD45+CD11b+GR1+ cells. Percentage of CD11b+Gr1+ cells from the total population of CD45+ cells isolated from ileal lamina propria cells collected from starved (n = 10) and stressed (n = 12) mice as determined by flow cytometry. Significance was determined by a two-tailed Mann–Whitney, p = 0.0040. j Number of GR1+ cells as determined by immunohistochemistry. Significance was determined by a two-tailed Mann–Whitney test, p = 0.0286. (*p ≤ 0.05; **p ≤ 0.01; ***p ≤ 0.001; ****p ≤ 0.0001). Error bars represent SEM and the line in CFU graphs indicates the geometric mean of the group.

