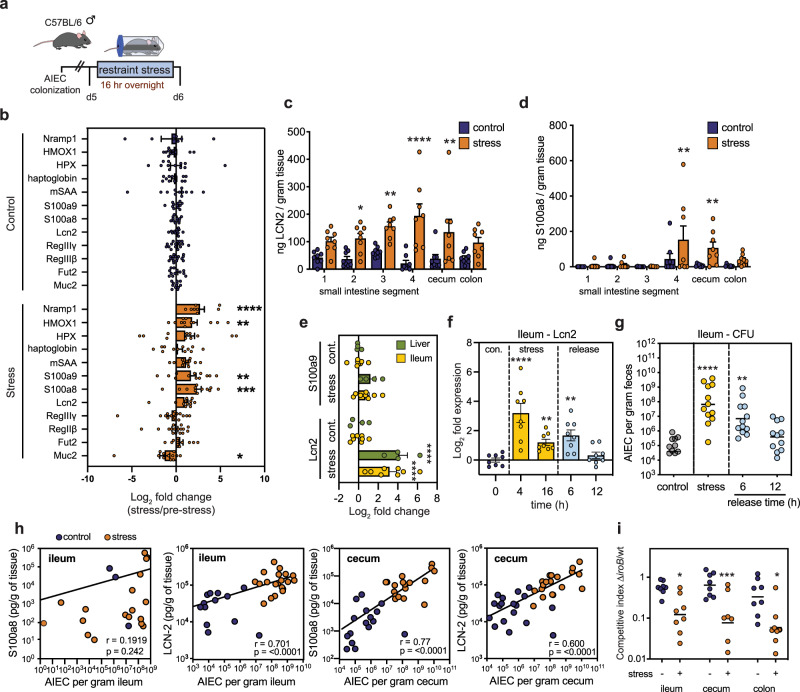
Fig. 4. Stress-induces nutritional immunity within the gut provides a competitive advantage to AIEC.
a Schematic representation of infection and stress protocol. b RT-qPCR analysis from ileal samples of AIEC-colonized starved (n = 12–16) or stressed (n = 12–16) mice. Significance was determined by two-way ANOVA, not corrected for multiple comparisons (n = Muc2 (c-12, s-12); Fut2 (c-12, s-12); Reg3β (c-16, s-16); Reg3γ (c-16, s-16); Lcn2 (c-12, s-12); S100a8 (c-12, s-12); S100a9 (c-12, s-12); mSAA (c-12, s-12); haptoglobin (c-11, s12); HPX (c-12, s-11); HMOX1 (c-11. s-12); nRAMP1 (c-7, s-8)); Muc2 p = 0.0452; S100a8 p = 0.0003; S100a9 p = 0.0092; HMOX1 p = 0.0017; NRAMP1 p < 0.0001. c Quantification of Lcn2 by ELISA along the length of the intestinal tract in AIEC-colonized starved (n = 8) and stressed (n = 8) mice. The small intestine was divided into four 8 cm segments in which segment 4 was proximal to the cecum. Significance was determined by two-way ANOVA, not corrected for multiple comparisons, Seg 1 p = 0.0551; Seg 2 p = 0.0164; Seg 3 p = 0.0033; Seg 4 p < 0.0001; Cecum p = 0.0023; Colon p = 0.0754. d Quantification of the calprotectin subunit S100a8 along the length of the intestinal tract in AIEC-colonized starved (n = 8) and stressed (n = 8) mice. Significance was determined by two-way ANOVA, not corrected for multiple comparisons, Seg 4 p = 0.0042, Cecum p = 0.0088. e RT-qPCR analysis of S100a9 and Lcn2 RNA expression in the liver and ileum of AIEC-colonized mice following 4 h of starvation (ileum n = 8, liver n = 4) or stress (ileum n = 8, liver n = 4). Significance to control was determined by one-way ANOVA, not corrected for multiple comparisons, Lcn2 control:stress, ileum, p < 0.0001; Lcn2 control:stress, liver, p < 0.0001. f RT-qPCR analysis of Lcn2 in the ileum. Samples were collected from AIEC-colonized mice at baseline as a control, 4 and 16 h of overnight stress, and at 6 and 12 h following restraint release (for all time points n = 8). Significance to control was determined by one-way ANOVA, not corrected for multiple comparisons, 4 h p < 0.0001; 16 h, p = 0.0070; 6 h, p = 0.0017. g AIEC fecal burdens collected from mice at baseline as a control (n = 11), 16 h of stress (n = 12), and at 6 h (n = 12) and 12 h (n = 11) following restraint release and recovery. Significance to control was determined by one-way ANOVA, not corrected for multiple comparisons, stress, p < 0.0001; 6 h release, p = 0.0016. h A two-tailed Spearman correlation of either calprotectin subunit S100a8 concentration or Lcn2 concentration and AIEC fecal burdens in the ileum and cecum (n = 40), ileum, p < 0.0001; cecum, p < 0.0001. i Competitive infection of wild-type AIEC and ΔiroB in starved (n = 8) and stressed (n = 8) mice. Mice were infected with a 1:1 ratio of wild type:∆iroB and were subjected to overnight starvation or stress 2 days later. Following stress or starvation, ileum, cecum, and colon tissues were collected and the ratio of wild type:∆iroB determined by selective plating. Significance was determined by a two-way ANOVA, not corrected for multiple comparisons, ileum, p = 0.0148; cecum, p = 0.0005; colon, p = 0.0201 (*p ≤ 0.05; **p ≤ 0.01; ***p ≤ 0.001). Error bars represent SEM and the line in CFU graphs indicates the geometric mean of the group.

