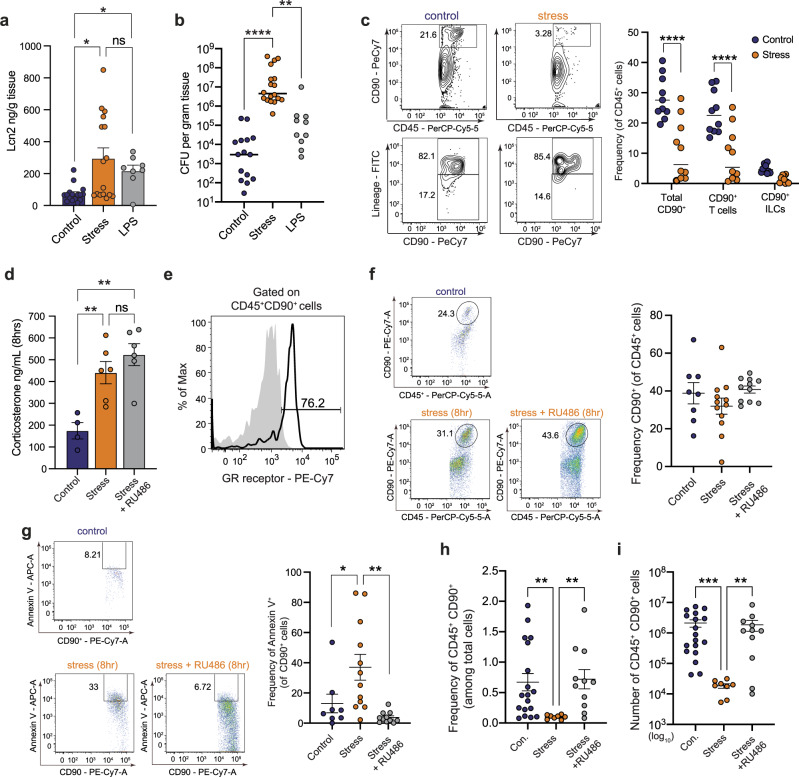
Fig. 5. Psychological stress induces attrition of CD90+ cells, resulting in defects in the IL-22 pathway.
a Quantification of ileal Lcn2 by ELISA in control (n = 16), stress (n = 16), and LPS treated (n = 8) mice. Significance was determined by a one-way ANOVA, not corrected for multiple comparisons, control:stress, p = 0.0141, control:LPS, p = 0.0466. b Ileal AIEC tissue burdens from control (n = 16), stress (n = 18), and LPS treated (n = 10) mice control:stress, p < 0.0001, control:LPS, p = 0.0079. c Representative flow plots of CD45+CD90+/− cells and lineage staining on CD45+CD90+. Percentage of CD90+ T cells and CD90+ lineage− ILCs of total CD45+ cells isolated from ileal lamina propria cells collected from starved (n = 10) and stressed (n = 10) mice as determined by flow cytometry. Significance was determined by two-way ANOVA, not corrected for multiple comparisons, p < 0.0001, p < 0.0001. d Quantification of corticosterone in the serum as determined by ELISA in control (n = 4), stress (n = 6), and RU486 treated stress (n = 6) mice. Significance was determined by one-way ANOVA, not corrected for multiple comparisons, control:stress, p = 0.0087; control:stress + RU486, p = 0.0011. e Representative flow plot of percentage of CD45+CD90+GR+ cells. f Frequency of CD45+CD90+ cells following 8 h of restraint stress in control (n = 8), stress (n = 12), and RU486 treated stress (n = 11) mice. g Frequency of CD45+CD90+AnnexinV+ cells following 8 h of restraint in control (n = 8), stress (n = 12), and RU486 treated stress (n = 11). Significance was determined by a one-way ANOVA, not corrected for multiple comparisons, control:stress, p = 0.0323, stress:stress + ru486 p = 0.0018. h Frequency of CD45+CD90+ cells following overnight restraint in control (n = 18), stress (n = 8), and RU486 treated stress (n = 11). Significance was determined by one-way ANOVA, not corrected for multiple comparisons, control:stress, p = 0.0079, stress:stress + ru486 p = 0.0043. i Absolute number of CD45+CD90+ cells following overnight restraint in control (n = 18), stress (n = 8), and RU486 treated stress (n = 11) mice. Significance was determined by two-way ANOVA, not corrected for multiple comparisons, control:stress, p = 0.0005, stress:stress + ru486 p = 0.0060. (*p ≤ 0.05; **p ≤ 0.01; ***p ≤ 0.001; ****p ≤ 0.0001). Error bars represent SEM and the line in CFU graphs indicates the geometric mean of the group.

