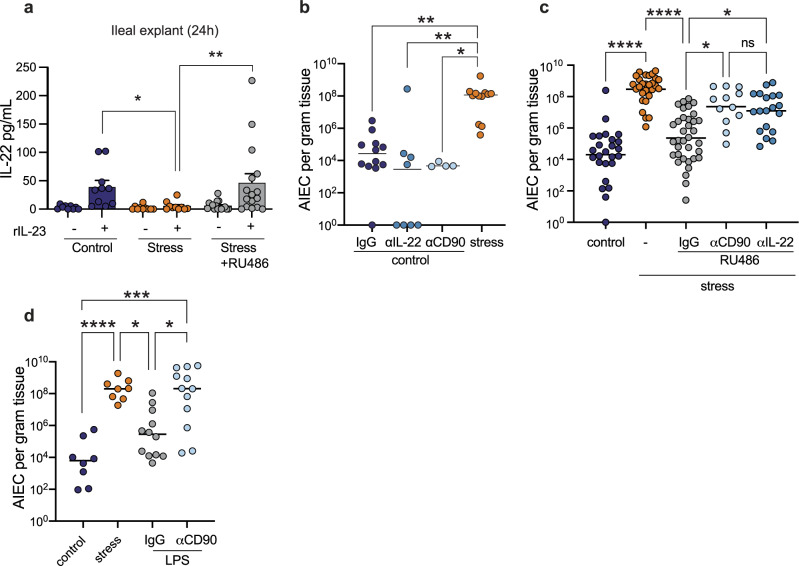
Fig. 6. Combinatorial effects of nutritional immunity and immune depletion are responsible for intestinal dysbiosis.
a Quantification of IL-22 in the supernatants of ileal explants from starved (n = 10), stressed (n = 10), RU486 treated stress (n = 16) mice stimulated with 20 ng/mL rIL-23 or media control for 24 h. Significance was determined by one-way ANOVA, not corrected for multiple comparisons, control:stress p = 0.0285, stress:stress RU486, p = 0.0033. b Ileal AIEC tissue burdens from control (n = 12), αIL-22 (n = 8), αCD90 treated (n = 4), and stress (n = 12) mice. Significance was determined by one-way ANOVA, not corrected for multiple comparisons, control:stress, p = 0.0063; control αIL-22: stress, p = 0.0013; control αCD90:stress, p = 0.0106. c Ileal AIEC tissue burdens from control (n = 19), stress (n = 22), RU486 treated stress (n = 25), RU486 and αCD90 treated stress (n = 12), and RU486 and αIL-22 treated stress (n = 13). Significance was determined by one-way ANOVA, not corrected for multiple comparisons, control:stress, p < 0.0001; stress:stress + RU486 IgG, p < 0.0001; stress + RU486 IgG:stress + RU486 αCD90 p = 0.0284; stress + RU486 IgG:stress + RU486 αIL-22, p = 0.0301. d Ileal AIEC tissue burden in control (n = 24), stress (n = 18), LPS treated (n = 22), and LPS and αCD90 treated (n = 12) mice. Significance was determined by one-way ANOVA, not corrected for multiple comparisons, control:stress, p = 0.0006; control:LPS + αCD90, p = 0.0003; stress:LPS, p = 0.0399; LPS:LPS + αCD90, p = 0.0357. (*p ≤ 0.05; **p ≤ 0.01; ***p ≤ 0.001; ****p ≤ 0.0001). Error bars represent SEM and the line in CFU graphs indicates the geometric mean of the group.

