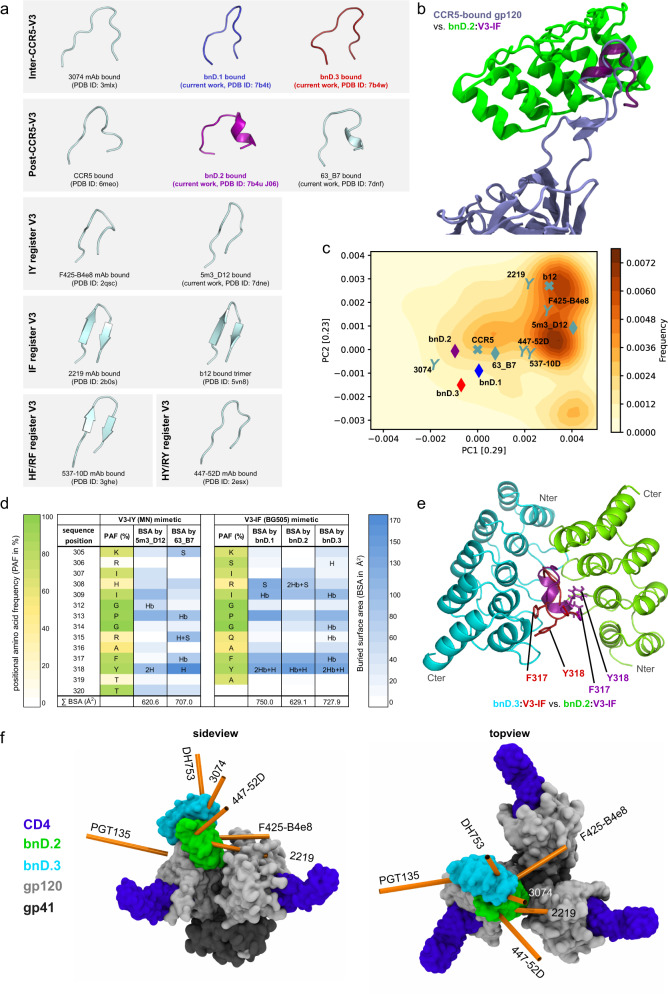
Fig. 3. V3-crown conformations recognized by bnDs and binding modes.
a Comparison of V3 conformations in complex with DARPins, mAbs, the CCR5 co-receptor, and in the partially open (b12-bound) Env trimer. 5m3_D12 and 63_B7 were co-crystallized with V3-IY (MN). bnD.1, bnD.2, and bnD.3 were co-crystallized with V3-IF (BG505). b Structural alignment of V3-IF (plum) in complex with bnD.2 (green) and CCR5-bound V3 (ice blue) (PDB ID: 6meo). For clarity, the D-Pro-L-Pro template of the V3-IF mimetic was omitted from the representation. c Principal component analysis for the conformational space sampled by the unliganded V3-crown during a molecular dynamics simulation of sCD4-bound, glycosylated gp120 initiated from the CD4 and CCR5-bound conformation (PDB ID: 6meo). Contour levels depict the frequency of adopted V3 conformations. The position of experimentally determined liganded V3 structures in the conformational space are marked by a diamond (V3-crown DARPin), Y (V3 mAb), or X (CCR5 co-receptor or CD4-binding site mAb b12) and labeled with the name of the respective ligand. Coloring according to a. d Summary of DARPin:V3-crown peptide interactions observed in the crystal structures listing the distribution of the buried surface area (BSA) on V3, total BSA, H-bonds (H), and salt-bridges (S). (Hb) indicates H-bonds with the V3 peptide backbone. The positional amino acid frequency (PAF) indicates how often each amino acid in the V3 peptide occurs in HIV-1 strains across group M (the V3 consensus sequence of group M is identical to V3 of strain BG505) (Supplementary Fig. 5). e Visualization of the interaction interface of bnD.2 (green) and bnD.3 (cyan) by structural alignment of the V3 peptides in PyMol. The side chains of key contact residues on V3 used by both bnDs are depicted with sticks. f Binding of V3-directed bnDs and mAbs modeled on the open Env trimer structure (bound by CD4 and the co-receptor-mimicking mAb 17b, PDB ID: 5vn311. Surface representation of gp41 (dark grey), gp120 (light grey), CD4 (purple), bnD.2 (green) and bnD.3 (cyan). The approach angles of the mAbs were computed by principal component analysis based on the structural coordinates of each Fab-fragment and are indicated with orange rods.

