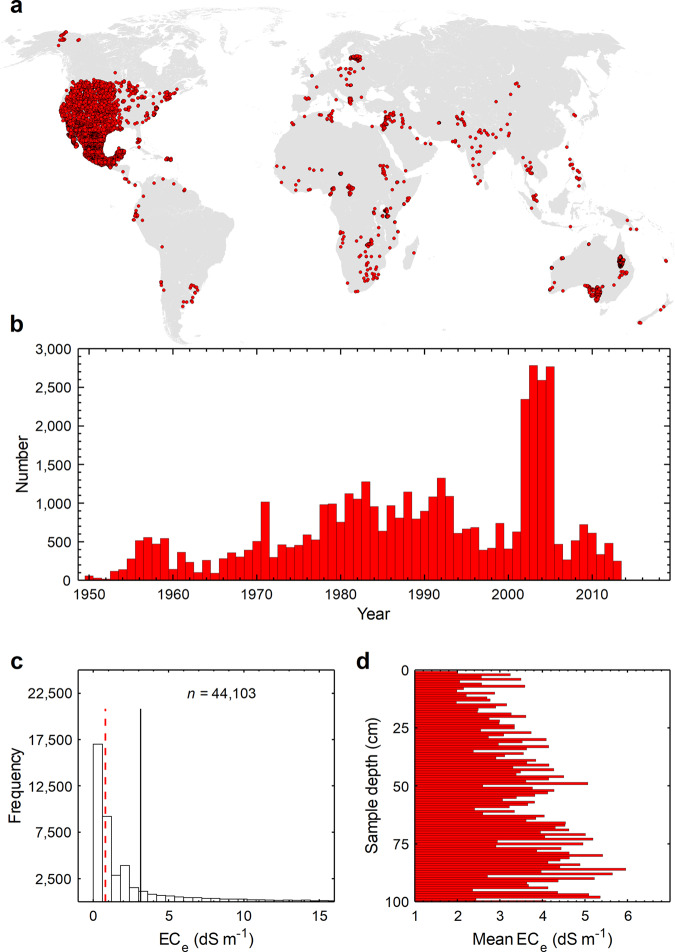
Fig. 4. General properties of the ECe profiles used for training the models.
a spatial distribution of the soil salinity profiles used for model training and prediction of the soil salinity. Each profile includes one or more soil samples. b temporal distribution of the samples used for training the predictive models of soil salinity. Each bar shows the number of samples within one year. c frequency distribution of the measured values of ECe. The solid and dashed vertical lines represent the mean and median values, respectively. d average of the measured soil salinity values at 1 cm intervals to the depth of 1 m below the surface.

