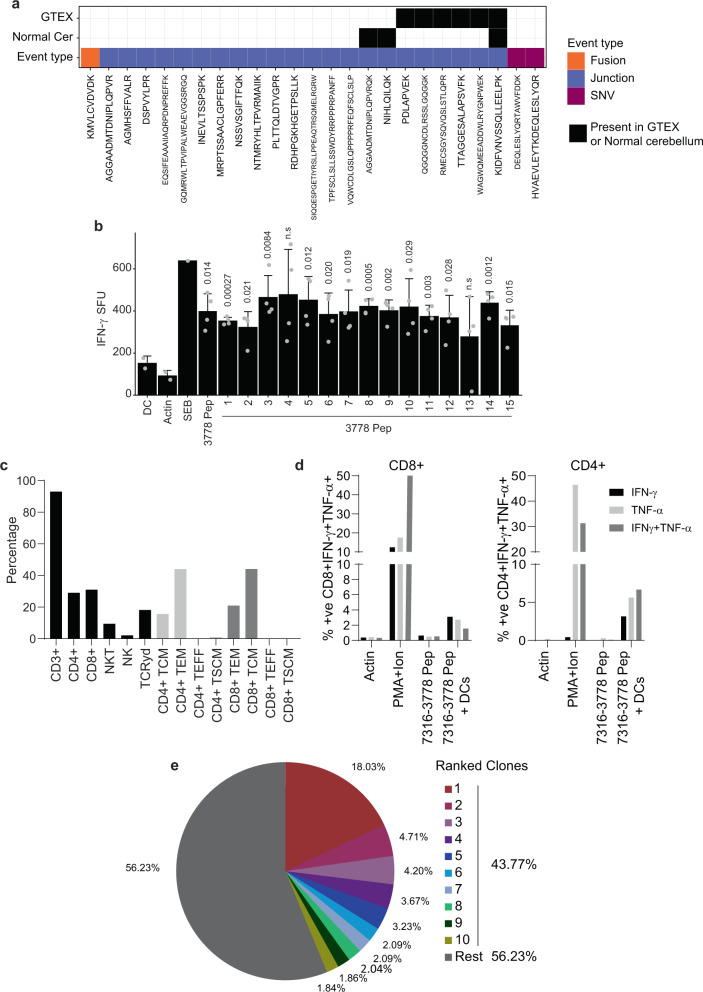
Fig. 3. Autologous tumor-specific peptides induce a specific IFN-γ response.
a Tile plot depicting the number of tumor-specific peptides identified in patient 7316-3778’s tumor. Black tiles indicate the unannotated peptides identified in healthy cerebellar or normal tissues from GTEX. SNVs, fusions, and junctions are displayed in purple, orange, and blue respectively. b Dendritic cells derived from patients 7316-3778 were loaded with peptides identified in the subject’s tumor by our proteogenomic pipeline. DCs were co-cultured with non-adherent cells as described. Following three stimulations, peptide-specific responses were assessed by anti-IFN-γ ELISpot. In the presence of peptide-loaded DCs, a significant anti-IFN-γ response was observed against 13/15 peptides. One-sided t-test was used to calculate the p-values, n = 4. p-values are indicated in the figure, n.s. non-significant. c Summary data of patient TSAT phenotype, memory, and differentiation status. Gating strategy TSAT populations and phenotypes (Supplementary Fig. 15). d To assess CD4- and CD8-specific cytokine function, TSAT were incubated in the presence of pooled peptides or peptide-loaded DCs. Summary of intracellular staining data showing specific CD4+ and CD8+ responses to 7316-3778 peptides in the presence of peptide-loaded DCs. Gating strategy for intracellular staining (Supplementary Fig. 15). e Results of TCR Vβ CDR3 sequencing on the 7316-3778 TSA T product. Pie chart of the top 10 clonotypes in the TSA T. Clonotypes are listed in Supplementary Data 5. SFU spot-forming units; 1 SFU = 1 T cell secreting IFN-γ. Actin: specific peptide control; PMA/Ionomycin positive control. Data are presented as mean values +/− SD. Source data are provided as a Source Data file.

