Figure 1.
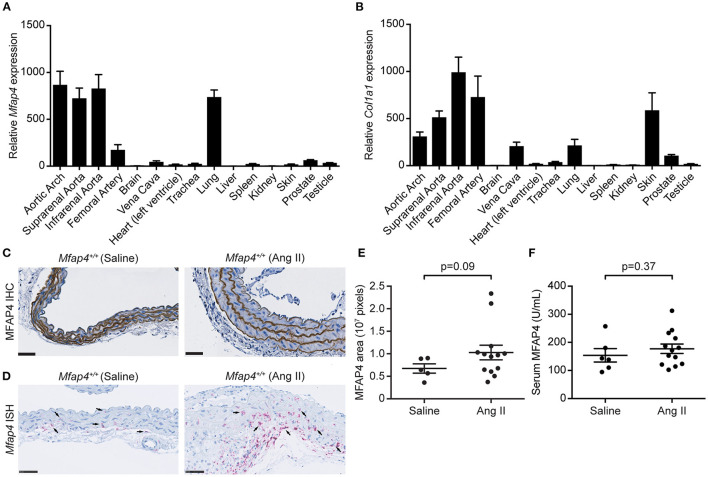
MFAP4 expression in normal aorta and AAA tissue. (A,B) Quantitative real-time PCR analysis of (A) Mfap4 and (B) Col1a1 mRNA transcripts in C57BL/6N mouse tissues (n = 7). Expression levels are normalized against eukaryotic 18S rRNA and presented as means + SEM. (C,D) Representative images of (C) MFAP4 immunohistochemical staining (IHC) and (D) Mfap4 in situ hybridization staining (ISH) in abdominal aortic sections in saline-infused and Ang II-infused ApoE−/− (Mfap4+/+) mice. Black arrows indicate examples of positive cells. n = 5–13. Scale bar = 50 μm. (E) Semi-quantitation of MFAP4 IHC staining intensity in the aortas of saline- and Ang II-infused ApoE−/− mice. (F) MFAP4 concentration in serum from saline- and Ang II-infused ApoE−/− mice. Data are analyzed with Mann-Whitney U-test.

